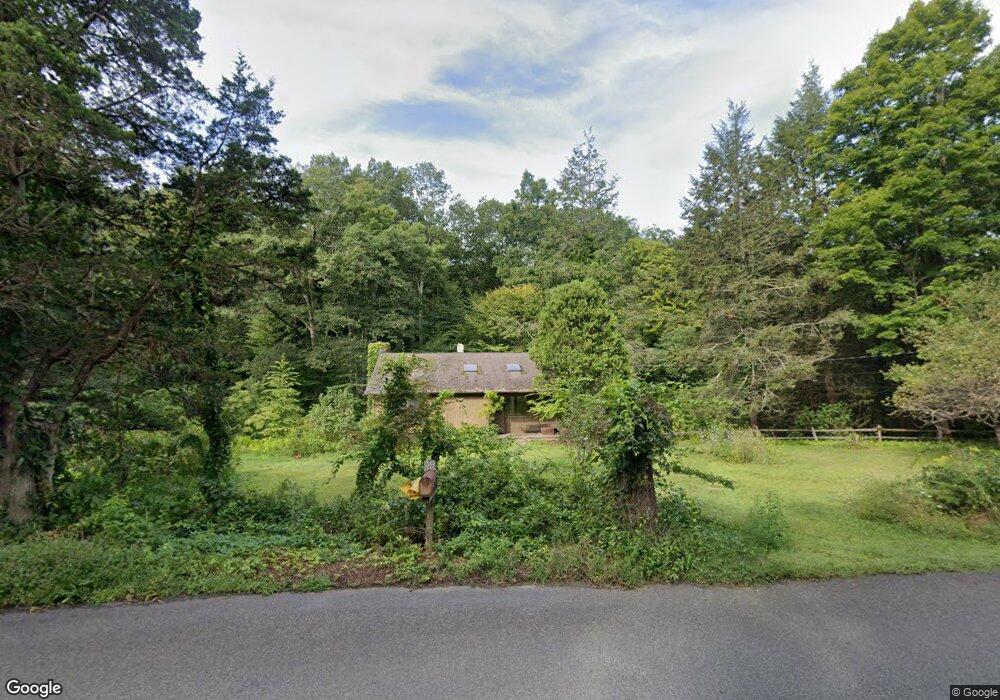
49 Hemlock Rd Roxbury, CT 06783
Estimated Value: $449,000 - $683,000
3
Beds
3
Baths
1,296
Sq Ft
$442/Sq Ft
Est. Value
About This Home
This home is located at 49 Hemlock Rd, Roxbury, CT 06783 and is currently estimated at $573,118, approximately $442 per square foot. 49 Hemlock Rd is a home located in Litchfield County with nearby schools including Shepaug Valley School and The Gunnery.
Ownership History
Date
Name
Owned For
Owner Type
Purchase Details
Closed on
Jan 15, 2020
Sold by
Piskura Andrew J Est
Bought by
Lawlor Nancy
Current Estimated Value
Home Financials for this Owner
Home Financials are based on the most recent Mortgage that was taken out on this home.
Original Mortgage
$189,900
Interest Rate
3.6%
Mortgage Type
New Conventional
Purchase Details
Closed on
Oct 26, 2006
Sold by
Piskara Eileen
Bought by
Piskara Andrew
Create a Home Valuation Report for This Property
The Home Valuation Report is an in-depth analysis detailing your home's value as well as a comparison with similar homes in the area
Home Values in the Area
Average Home Value in this Area
Purchase History
| Date | Buyer | Sale Price | Title Company |
|---|---|---|---|
| Lawlor Nancy | $211,000 | None Available | |
| Lawlor Nancy | $211,000 | None Available | |
| Piskara Andrew | -- | -- | |
| Piskara Andrew | -- | -- |
Source: Public Records
Mortgage History
| Date | Status | Borrower | Loan Amount |
|---|---|---|---|
| Previous Owner | Lawlor Nancy | $189,900 |
Source: Public Records
Tax History
| Year | Tax Paid | Tax Assessment Tax Assessment Total Assessment is a certain percentage of the fair market value that is determined by local assessors to be the total taxable value of land and additions on the property. | Land | Improvement |
|---|---|---|---|---|
| 2025 | $3,713 | $285,600 | $144,900 | $140,700 |
| 2024 | $3,599 | $285,600 | $144,900 | $140,700 |
| 2023 | $3,599 | $285,600 | $144,900 | $140,700 |
| 2022 | $3,903 | $255,940 | $151,340 | $104,600 |
| 2021 | $3,941 | $255,940 | $151,340 | $104,600 |
| 2020 | $4,044 | $255,940 | $151,340 | $104,600 |
| 2019 | $4,057 | $255,940 | $151,340 | $104,600 |
| 2018 | $4,057 | $255,940 | $151,340 | $104,600 |
| 2017 | $4,025 | $283,460 | $154,000 | $129,460 |
| 2016 | $3,883 | $283,460 | $154,000 | $129,460 |
| 2015 | $3,883 | $283,460 | $154,000 | $129,460 |
| 2014 | $3,798 | $283,460 | $154,000 | $129,460 |
Source: Public Records
Map
Nearby Homes
- 45 Chalybes Rd
- Lot 4 Chalybes Rd W
- Lot 1 Chalybes Rd W
- 11 Evergreen Dr
- 47 South St
- 8 Bayberry Hill
- 50 Southbury Rd
- 85 Good Hill Rd
- 204 North St Unit Lot 3
- 200 North St
- 0 Booth Rd
- 179 South St
- 50 Beardsley Rd
- 4 Judge Rd
- 176 Apple Ln
- 69 Moosehorn Rd
- 11 Ravenrock
- 99 Carriage Ln
- 190 Blueberry Hill Rd
- 22 Standish Rd
- 00 Chalybes Rd W
- 0 Chalybes Rd W Unit 99148182
- 0 Chalybes Rd W
- 57 Chalybes Rd W
- 43 Hemlock Rd
- 44 Chalybes Rd
- 53 Hemlock Rd
- 92 Hemlock Rd
- 65 Chalybes Rd W
- 31 Hemlock Rd
- 60 Chalybes Rd W
- 0 Cedar Ridge Unit L131229
- 0 Cedar Ridge Unit L138716
- 0 Cedar Ridge Unit L149143
- 0 Cedar Ridge Unit 99190544
- 0 Cedar Ridge
- 00 Cedar Ridge
- 81 Chalybes Rd W
- 85 Chalybes Rd W
- Lot 00 Chalybes Rd W
Your Personal Tour Guide
Ask me questions while you tour the home.