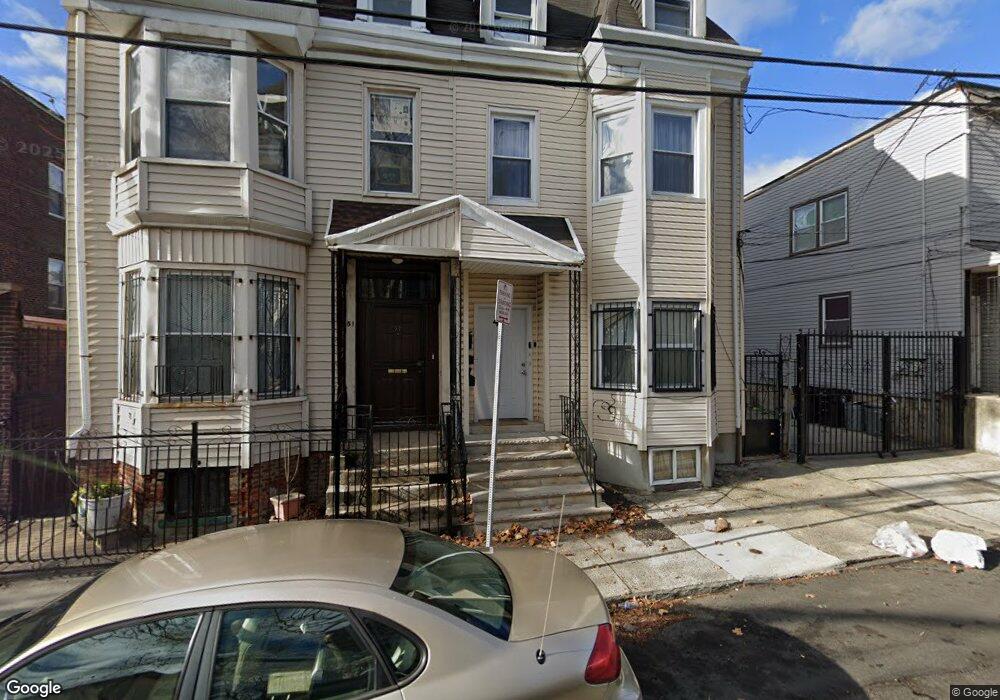
49 Hudson St Newark, NJ 07103
University Heights NeighborhoodEstimated Value: $458,135 - $563,000
--
Bed
--
Bath
3,124
Sq Ft
$163/Sq Ft
Est. Value
About This Home
This home is located at 49 Hudson St, Newark, NJ 07103 and is currently estimated at $508,784, approximately $162 per square foot. 49 Hudson St is a home located in Essex County with nearby schools including Sir Isaac Newton Elementary School, Camden Street Elementary School, and Cleveland Elementary School.
Ownership History
Date
Name
Owned For
Owner Type
Purchase Details
Closed on
Apr 7, 2022
Sold by
Arostegui Milca
Bought by
Arostegui Patricio J
Current Estimated Value
Home Financials for this Owner
Home Financials are based on the most recent Mortgage that was taken out on this home.
Original Mortgage
$156,259
Outstanding Balance
$127,740
Interest Rate
3.63%
Mortgage Type
New Conventional
Estimated Equity
$381,044
Purchase Details
Closed on
Aug 14, 2007
Sold by
Arostegui Fabricio and Arostegui Milca
Bought by
Arostegui Fabricio and Arostegui Milca
Home Financials for this Owner
Home Financials are based on the most recent Mortgage that was taken out on this home.
Original Mortgage
$228,800
Interest Rate
5.37%
Mortgage Type
New Conventional
Purchase Details
Closed on
Jan 4, 2002
Sold by
Arostegui Fabricio
Bought by
Arostegui Fabricio and Arostegui Milca
Purchase Details
Closed on
Jul 30, 1993
Sold by
Arostequi Fabricio and Arostequi Miica
Bought by
Bustamante Arasely
Purchase Details
Closed on
Sep 5, 1992
Sold by
Colon Erma
Bought by
Arostegui Fabricio and Arostegui Milca
Purchase Details
Closed on
Jun 2, 1992
Sold by
Robriguez Jose Luques and Robriguez Lfonsa L
Bought by
Colon Erma
Create a Home Valuation Report for This Property
The Home Valuation Report is an in-depth analysis detailing your home's value as well as a comparison with similar homes in the area
Home Values in the Area
Average Home Value in this Area
Purchase History
| Date | Buyer | Sale Price | Title Company |
|---|---|---|---|
| Arostegui Patricio J | -- | Guardian Title Services | |
| Arostegui Fabricio | -- | None Available | |
| Arostegui Fabricio | -- | -- | |
| Bustamante Arasely | $100 | -- | |
| Arostegui Fabricio | $50,000 | -- | |
| Colon Erma | -- | -- |
Source: Public Records
Mortgage History
| Date | Status | Borrower | Loan Amount |
|---|---|---|---|
| Open | Arostegui Patricio J | $156,259 | |
| Previous Owner | Arostegui Fabricio | $228,800 |
Source: Public Records
Tax History Compared to Growth
Tax History
| Year | Tax Paid | Tax Assessment Tax Assessment Total Assessment is a certain percentage of the fair market value that is determined by local assessors to be the total taxable value of land and additions on the property. | Land | Improvement |
|---|---|---|---|---|
| 2025 | $4,921 | $132,000 | $19,800 | $112,200 |
| 2024 | $4,921 | $132,000 | $19,800 | $112,200 |
| 2022 | $4,932 | $132,000 | $19,800 | $112,200 |
| 2021 | $4,929 | $132,000 | $19,800 | $112,200 |
| 2020 | $5,016 | $132,000 | $19,800 | $112,200 |
| 2019 | $4,965 | $132,000 | $19,800 | $112,200 |
| 2018 | $4,875 | $132,000 | $19,800 | $112,200 |
| 2017 | $4,699 | $132,000 | $19,800 | $112,200 |
| 2016 | $4,541 | $132,000 | $19,800 | $112,200 |
| 2015 | $4,368 | $132,000 | $19,800 | $112,200 |
| 2014 | $4,093 | $132,000 | $19,800 | $112,200 |
Source: Public Records
Map
Nearby Homes