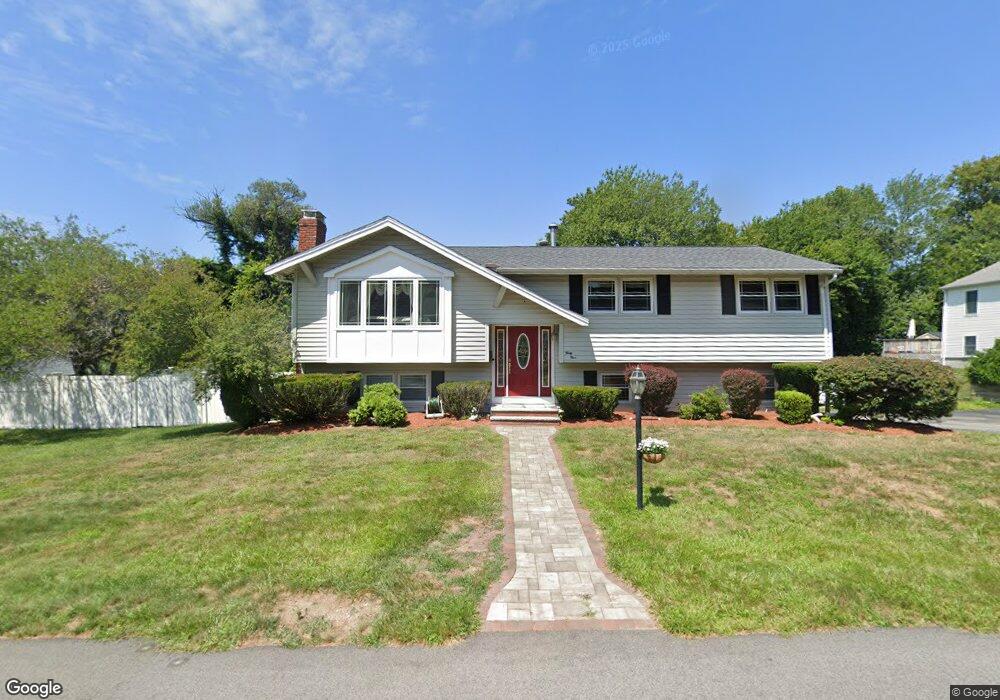
49 Logan Dr Braintree, MA 02184
East Braintree NeighborhoodEstimated Value: $778,000 - $945,000
3
Beds
3
Baths
2,376
Sq Ft
$365/Sq Ft
Est. Value
About This Home
This home is located at 49 Logan Dr, Braintree, MA 02184 and is currently estimated at $866,861, approximately $364 per square foot. 49 Logan Dr is a home located in Norfolk County with nearby schools including Braintree High School, Step Ahead Kindergarten, and Sacred Heart Elementary School.
Ownership History
Date
Name
Owned For
Owner Type
Purchase Details
Closed on
Feb 14, 2006
Sold by
Valle Teresa A and Valle Victor P
Bought by
Valle Paul and Valle Sharon A
Current Estimated Value
Home Financials for this Owner
Home Financials are based on the most recent Mortgage that was taken out on this home.
Original Mortgage
$300,000
Interest Rate
6.27%
Mortgage Type
Purchase Money Mortgage
Create a Home Valuation Report for This Property
The Home Valuation Report is an in-depth analysis detailing your home's value as well as a comparison with similar homes in the area
Home Values in the Area
Average Home Value in this Area
Purchase History
| Date | Buyer | Sale Price | Title Company |
|---|---|---|---|
| Valle Paul | $450,000 | -- | |
| Valle Paul | $450,000 | -- |
Source: Public Records
Mortgage History
| Date | Status | Borrower | Loan Amount |
|---|---|---|---|
| Open | Valle Paul | $314,495 | |
| Closed | Valle Paul | $300,000 | |
| Closed | Valle Paul | $105,000 |
Source: Public Records
Tax History
| Year | Tax Paid | Tax Assessment Tax Assessment Total Assessment is a certain percentage of the fair market value that is determined by local assessors to be the total taxable value of land and additions on the property. | Land | Improvement |
|---|---|---|---|---|
| 2025 | $7,653 | $766,800 | $399,300 | $367,500 |
| 2024 | $6,847 | $722,300 | $367,800 | $354,500 |
| 2023 | $6,539 | $670,000 | $336,300 | $333,700 |
| 2022 | $6,248 | $627,900 | $294,200 | $333,700 |
| 2021 | $5,863 | $589,200 | $265,900 | $323,300 |
| 2020 | $5,571 | $565,000 | $241,700 | $323,300 |
| 2019 | $5,447 | $539,800 | $241,700 | $298,100 |
| 2018 | $5,223 | $495,500 | $210,200 | $285,300 |
| 2017 | $5,049 | $470,100 | $199,700 | $270,400 |
| 2016 | $4,952 | $451,000 | $189,100 | $261,900 |
| 2015 | $4,922 | $444,600 | $184,900 | $259,700 |
| 2014 | $4,456 | $390,200 | $160,800 | $229,400 |
Source: Public Records
Map
Nearby Homes
- 36 Chestnut Ave
- 31 Doris Rd
- 605 Middle St Unit 38
- 564 Middle St
- 14 Hillside Rd
- 599 Union St
- 632 Washington St Unit G5
- 5 Woodsum Dr Unit 12
- 469-471 Washington St
- 300 Commercial St Unit 23
- 491 Washington St Unit 1
- 426 John Mahar Hwy Unit 311
- 426 John Mahar Hwy Unit 406
- 422 John Mahar Hwy Unit 408
- 26 Tingley Rd
- 37 Lantern Ln
- 41 Lantern Ln
- 18 Hobart St
- 58 Norma Ave
- 140 Commercial St
Your Personal Tour Guide
Ask me questions while you tour the home.