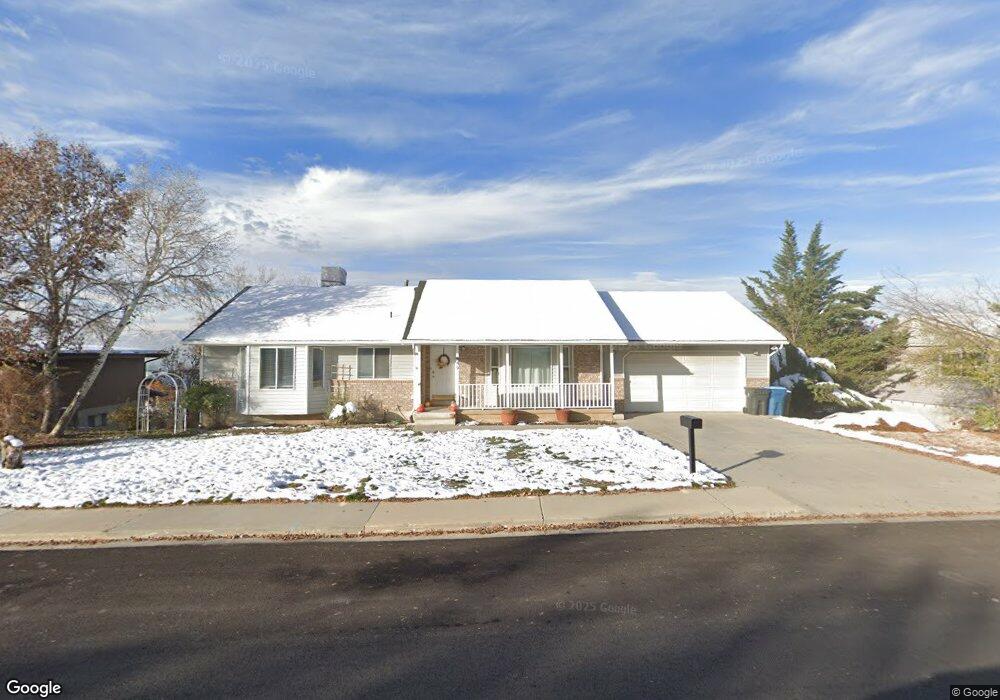
49 N 1300 E Pleasant Grove, UT 84062
Estimated Value: $586,058 - $628,000
5
Beds
3
Baths
2,724
Sq Ft
$223/Sq Ft
Est. Value
About This Home
This home is located at 49 N 1300 E, Pleasant Grove, UT 84062 and is currently estimated at $607,353, approximately $222 per square foot. 49 N 1300 E is a home located in Utah County with nearby schools including Grovecrest Elementary School, Pleasant Grove Junior High School, and Pleasant Grove High School.
Ownership History
Date
Name
Owned For
Owner Type
Purchase Details
Closed on
Nov 30, 2021
Sold by
Moyes Kirt and Moves Sarah Ruth
Bought by
Feher Lance and Rawle Andrea
Current Estimated Value
Home Financials for this Owner
Home Financials are based on the most recent Mortgage that was taken out on this home.
Original Mortgage
$415,000
Outstanding Balance
$377,632
Interest Rate
3.09%
Mortgage Type
New Conventional
Estimated Equity
$229,721
Purchase Details
Closed on
Oct 26, 2005
Sold by
Moyes Kirt M and Moyes Sarah Ruth
Bought by
Moyes Kirt and Moyes Sarah Ruth
Home Financials for this Owner
Home Financials are based on the most recent Mortgage that was taken out on this home.
Original Mortgage
$180,500
Interest Rate
6.67%
Mortgage Type
New Conventional
Purchase Details
Closed on
Dec 2, 1998
Sold by
Ellwood Anne F
Bought by
Shumway Scott
Create a Home Valuation Report for This Property
The Home Valuation Report is an in-depth analysis detailing your home's value as well as a comparison with similar homes in the area
Home Values in the Area
Average Home Value in this Area
Purchase History
| Date | Buyer | Sale Price | Title Company |
|---|---|---|---|
| Feher Lance | -- | Inwest Title | |
| Moyes Kirt | -- | Pinnacle Title | |
| Shumway Scott | -- | -- |
Source: Public Records
Mortgage History
| Date | Status | Borrower | Loan Amount |
|---|---|---|---|
| Open | Feher Lance | $415,000 | |
| Previous Owner | Moyes Kirt | $180,500 |
Source: Public Records
Tax History
| Year | Tax Paid | Tax Assessment Tax Assessment Total Assessment is a certain percentage of the fair market value that is determined by local assessors to be the total taxable value of land and additions on the property. | Land | Improvement |
|---|---|---|---|---|
| 2025 | $2,357 | $305,690 | -- | -- |
| 2024 | $2,357 | $281,270 | $0 | $0 |
| 2023 | $2,293 | $280,170 | $0 | $0 |
| 2022 | $2,373 | $288,530 | $0 | $0 |
| 2021 | $2,055 | $380,400 | $159,400 | $221,000 |
| 2020 | $1,881 | $341,400 | $142,300 | $199,100 |
| 2019 | $1,727 | $324,100 | $125,000 | $199,100 |
| 2018 | $1,632 | $289,500 | $116,400 | $173,100 |
| 2017 | $1,529 | $144,430 | $0 | $0 |
| 2016 | $1,492 | $136,070 | $0 | $0 |
| 2015 | $1,576 | $136,070 | $0 | $0 |
| 2014 | $1,499 | $128,260 | $0 | $0 |
Source: Public Records
Map
Nearby Homes
Your Personal Tour Guide
Ask me questions while you tour the home.