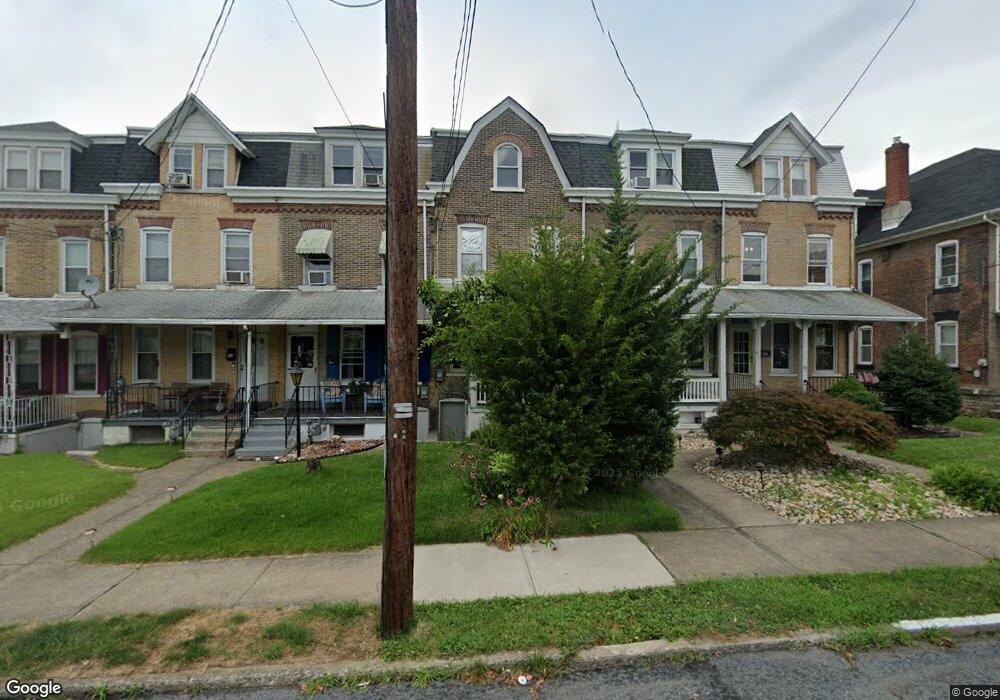
49 N 3rd St Coplay, PA 18037
Estimated Value: $206,000 - $232,391
4
Beds
1
Bath
1,480
Sq Ft
$149/Sq Ft
Est. Value
About This Home
This home is located at 49 N 3rd St, Coplay, PA 18037 and is currently estimated at $220,348, approximately $148 per square foot. 49 N 3rd St is a home located in Lehigh County with nearby schools including George D Steckel Elementary School, Zephyr Elementary School, and Clarence M Gockley Elementary School.
Ownership History
Date
Name
Owned For
Owner Type
Purchase Details
Closed on
May 31, 2005
Sold by
Gerancher Charles J and Gerancher Christine L
Bought by
Cavacini Jacey C
Current Estimated Value
Home Financials for this Owner
Home Financials are based on the most recent Mortgage that was taken out on this home.
Original Mortgage
$87,500
Outstanding Balance
$44,112
Interest Rate
5.83%
Mortgage Type
Fannie Mae Freddie Mac
Estimated Equity
$176,236
Purchase Details
Closed on
Feb 4, 2003
Sold by
Gerancher Charles J
Bought by
Gerancher Charles J and Gerancher Christine L
Home Financials for this Owner
Home Financials are based on the most recent Mortgage that was taken out on this home.
Original Mortgage
$59,000
Interest Rate
5.88%
Mortgage Type
Purchase Money Mortgage
Purchase Details
Closed on
Dec 18, 1992
Sold by
Delong Christine E
Bought by
Gerancher Charles J
Purchase Details
Closed on
Apr 2, 1987
Sold by
Delong Christine E and Delong Kemmer M
Bought by
Delong Christine E
Purchase Details
Closed on
Aug 29, 1986
Bought by
Delong Christine E and Delong Kemmer M
Create a Home Valuation Report for This Property
The Home Valuation Report is an in-depth analysis detailing your home's value as well as a comparison with similar homes in the area
Home Values in the Area
Average Home Value in this Area
Purchase History
| Date | Buyer | Sale Price | Title Company |
|---|---|---|---|
| Cavacini Jacey C | $105,250 | -- | |
| Gerancher Charles J | -- | Lawyers Title Insurance Corp | |
| Gerancher Charles J | $69,000 | -- | |
| Delong Christine E | $19,000 | -- | |
| Delong Christine E | $38,000 | -- |
Source: Public Records
Mortgage History
| Date | Status | Borrower | Loan Amount |
|---|---|---|---|
| Open | Cavacini Jacey C | $87,500 | |
| Previous Owner | Gerancher Charles J | $59,000 |
Source: Public Records
Tax History
| Year | Tax Paid | Tax Assessment Tax Assessment Total Assessment is a certain percentage of the fair market value that is determined by local assessors to be the total taxable value of land and additions on the property. | Land | Improvement |
|---|---|---|---|---|
| 2026 | $3,808 | $105,600 | $9,700 | $95,900 |
| 2025 | $3,676 | $105,600 | $9,700 | $95,900 |
| 2024 | $3,577 | $105,600 | $9,700 | $95,900 |
| 2023 | $3,384 | $105,600 | $9,700 | $95,900 |
| 2022 | $3,318 | $105,600 | $95,900 | $9,700 |
| 2021 | $3,194 | $105,600 | $9,700 | $95,900 |
| 2020 | $2,961 | $105,600 | $9,700 | $95,900 |
| 2019 | $2,782 | $105,600 | $9,700 | $95,900 |
| 2018 | $2,653 | $105,600 | $9,700 | $95,900 |
| 2017 | $2,577 | $105,600 | $9,700 | $95,900 |
| 2016 | -- | $105,600 | $9,700 | $95,900 |
| 2015 | -- | $105,600 | $9,700 | $95,900 |
| 2014 | -- | $105,600 | $9,700 | $95,900 |
Source: Public Records
Map
Nearby Homes
Your Personal Tour Guide
Ask me questions while you tour the home.