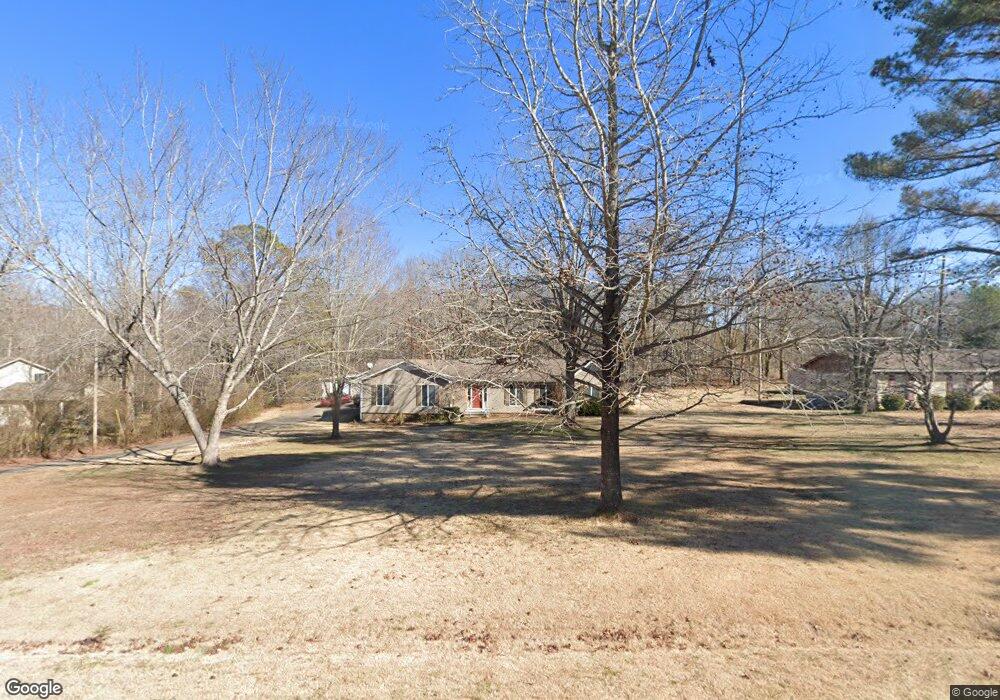
49 N Elysian Dr Selmer, TN 38375
Estimated Value: $270,518 - $359,000
Studio
4
Baths
2,928
Sq Ft
$112/Sq Ft
Est. Value
About This Home
This home is located at 49 N Elysian Dr, Selmer, TN 38375 and is currently estimated at $327,630, approximately $111 per square foot. 49 N Elysian Dr is a home located in McNairy County with nearby schools including Selmer Elementary School, Bethel Springs Elementary School, and Ramer Elementary School.
Ownership History
Date
Name
Owned For
Owner Type
Purchase Details
Closed on
Feb 5, 2022
Sold by
Pylate James C and Pylate Jimmy R
Bought by
Pylate Jimmy R
Current Estimated Value
Home Financials for this Owner
Home Financials are based on the most recent Mortgage that was taken out on this home.
Original Mortgage
$183,150
Interest Rate
3.55%
Mortgage Type
FHA
Purchase Details
Closed on
Aug 12, 2013
Sold by
Mitchell Wayne D
Bought by
Pylate James C and Pylate Jimmy R
Home Financials for this Owner
Home Financials are based on the most recent Mortgage that was taken out on this home.
Original Mortgage
$130,000
Interest Rate
4.48%
Mortgage Type
Commercial
Purchase Details
Closed on
Mar 18, 2002
Sold by
Dana Ashe
Bought by
Mitchell Julie A and Mitchell Wayne D
Purchase Details
Closed on
Dec 15, 1998
Sold by
Reaves Joe D and Reaves Darlene D
Bought by
Mitchell Wayne D and Mitchell Julie A
Purchase Details
Closed on
Oct 9, 1992
Bought by
Reaves Joe D Dabbs Darlene
Purchase Details
Closed on
Apr 25, 1991
Bought by
Reaves Clifton
Create a Home Valuation Report for This Property
The Home Valuation Report is an in-depth analysis detailing your home's value as well as a comparison with similar homes in the area
Home Values in the Area
Average Home Value in this Area
Purchase History
We collect this data history from publicly available records. To have your information removed, we recommend requesting removal directly through your county’s website.
| Date | Buyer | Sale Price | Title Company |
|---|---|---|---|
| Pylate Jimmy R | -- | Windsor John O | |
| Pylate Jimmy R | -- | None Listed On Document | |
| Pylate James C | $145,000 | -- | |
| Mitchell Julie A | $2,000 | -- | |
| Mitchell Wayne D | $118,000 | -- | |
| Reaves Joe D Dabbs Darlene | $75,000 | -- | |
| Reaves Clifton | $34,000 | -- |
Source: Public Records
Mortgage History
We collect this data history from publicly available records. To have your information removed, we recommend requesting removal directly through your county’s website.
| Date | Status | Borrower | Loan Amount |
|---|---|---|---|
| Previous Owner | Pylate Jimmy R | $183,150 | |
| Previous Owner | Pylate James C | $130,000 |
Source: Public Records
Tax History
| Year | Tax Paid | Tax Assessment Tax Assessment Total Assessment is a certain percentage of the fair market value that is determined by local assessors to be the total taxable value of land and additions on the property. | Land | Improvement |
|---|---|---|---|---|
| 2025 | -- | $60,125 | $2,525 | $57,600 |
| 2024 | -- | $60,125 | $2,525 | $57,600 |
| 2023 | $1,323 | $60,125 | $2,525 | $57,600 |
| 2022 | $1,323 | $60,125 | $2,525 | $57,600 |
| 2021 | $1,061 | $37,050 | $2,925 | $34,125 |
| 2020 | $1,061 | $37,050 | $2,925 | $34,125 |
| 2019 | $1,061 | $37,050 | $2,925 | $34,125 |
| 2018 | $1,043 | $37,050 | $2,925 | $34,125 |
| 2017 | $1,043 | $37,050 | $2,925 | $34,125 |
| 2016 | $1,028 | $37,050 | $2,925 | $34,125 |
| 2015 | $1,073 | $37,050 | $2,925 | $34,125 |
| 2014 | $1,099 | $37,950 | $2,925 | $35,025 |
Source: Public Records
Map
Nearby Homes
- 436 Skyline Dr
- 000 Mulberry Ave
- 745 Mulberry Ave
- 0 Mulberry Ave Unit RTC3134763
- 979 E Poplar Ave
- 122 Treece St
- 1 Country Woods Dr
- 20 Country Woods Dr
- 12 Country Woods Dr
- 0 Sewell Rd Unit 10207148
- 131 Hideaway Square
- 180 Horner Dr
- 1152 E Poplar Ave
- 239 Old No 5
- 0000 Woodmont Dr
- 394 Oakgrove Rd
- 635 Purdy Rd
- 401 E Poplar Ave
- 130 Glen Dr
- 220 Forrest St
- 37 N Elysian Dr
- 81 N Elysian Dr Unit 469611
- 81 N Elysian Dr
- 0 N Elysian Dr
- 78 N Elysian Dr
- 559 Skyline Dr Unit OF
- 524 Skyline Dr
- 20 S Elysian Dr
- 94 N Elysian Dr
- 502 Skyline Dr
- 50 S Elysian Dr
- 58 Smithfield Dr
- 20 Burkhill Cove
- 501 Skyline Dr
- 84 Smithfield Dr
- 78 S Elysian Dr
- 50 Burkhill Cove
- 50 Burkhill Cove
- 54 Edith Ln
- 100 Burkhill Cove
Your Personal Tour Guide
Ask me questions while you tour the home.