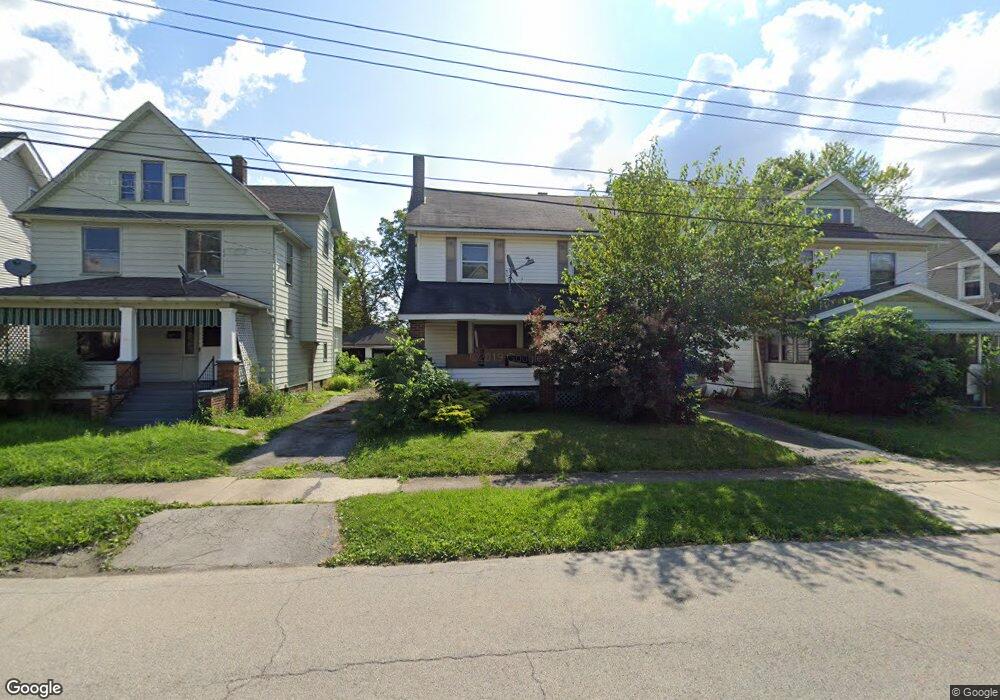
49 N Evanston Ave Youngstown, OH 44509
Belle Vista NeighborhoodEstimated Value: $63,000 - $95,000
3
Beds
1
Bath
1,456
Sq Ft
$53/Sq Ft
Est. Value
About This Home
This home is located at 49 N Evanston Ave, Youngstown, OH 44509 and is currently estimated at $76,443, approximately $52 per square foot. 49 N Evanston Ave is a home located in Mahoning County with nearby schools including Volney Rogers Elementary School, Chaney High School, and Summit Academy - Youngstown.
Ownership History
Date
Name
Owned For
Owner Type
Purchase Details
Closed on
Nov 29, 2019
Sold by
Lindolph Joanne
Bought by
Deeds Ronald
Current Estimated Value
Purchase Details
Closed on
Mar 17, 2015
Sold by
Lindolph Robert K
Bought by
Lindolph Joanne L
Purchase Details
Closed on
Aug 20, 2007
Sold by
Wells Fargo Bank Na
Bought by
Abuhashim Raeid A and Abuhashim Nadaa A
Purchase Details
Closed on
May 17, 2007
Sold by
Williams Louise
Bought by
Wells Fargo Bank Na
Purchase Details
Closed on
Nov 19, 2004
Sold by
Root Roy
Bought by
Williams Louise
Home Financials for this Owner
Home Financials are based on the most recent Mortgage that was taken out on this home.
Original Mortgage
$52,700
Interest Rate
5.86%
Mortgage Type
Purchase Money Mortgage
Purchase Details
Closed on
Mar 30, 1981
Bought by
Piasky Raymond R
Create a Home Valuation Report for This Property
The Home Valuation Report is an in-depth analysis detailing your home's value as well as a comparison with similar homes in the area
Home Values in the Area
Average Home Value in this Area
Purchase History
| Date | Buyer | Sale Price | Title Company |
|---|---|---|---|
| Deeds Ronald | $7,500 | None Available | |
| Lindolph Joanne L | -- | Attorney | |
| Abuhashim Raeid A | $15,000 | Attorney | |
| Wells Fargo Bank Na | $28,000 | None Available | |
| Williams Louise | $62,000 | Foundation Title Agency Ltd | |
| Piasky Raymond R | -- | -- |
Source: Public Records
Mortgage History
| Date | Status | Borrower | Loan Amount |
|---|---|---|---|
| Previous Owner | Williams Louise | $52,700 | |
| Closed | Williams Louise | $6,200 |
Source: Public Records
Tax History Compared to Growth
Tax History
| Year | Tax Paid | Tax Assessment Tax Assessment Total Assessment is a certain percentage of the fair market value that is determined by local assessors to be the total taxable value of land and additions on the property. | Land | Improvement |
|---|---|---|---|---|
| 2024 | $502 | $10,510 | $1,070 | $9,440 |
| 2023 | $498 | $10,510 | $1,070 | $9,440 |
| 2022 | $417 | $6,760 | $1,060 | $5,700 |
| 2021 | $417 | $6,760 | $1,060 | $5,700 |
| 2020 | $419 | $6,760 | $1,060 | $5,700 |
| 2019 | $412 | $5,930 | $930 | $5,000 |
| 2018 | $437 | $5,930 | $930 | $5,000 |
| 2017 | $413 | $5,930 | $930 | $5,000 |
| 2016 | $646 | $10,000 | $1,430 | $8,570 |
| 2015 | $682 | $10,000 | $1,430 | $8,570 |
| 2014 | -- | $10,000 | $1,430 | $8,570 |
| 2013 | $637 | $10,000 | $1,430 | $8,570 |
Source: Public Records
Map
Nearby Homes
- 60 Steel St
- 1594 2nd St
- 1595 2nd St
- 1611 Wellington Ave
- 15 S Portland Ave
- 1711 Wellington Ave
- 219 N Maryland Ave
- 1751 Mahoning Ave
- 77 Fernwood Ave
- 1726 Midland Ave
- 1516 Midland Ave
- 112 Glacier Ave
- 134 Millet Ave
- 1639 Butler Ave
- 1947 Manhattan Ave
- 115 N Richview Ave
- 120 Whitney Ave S
- 2113 Manhattan Ave
- 234 S Portland Ave
- 107 N Hartford Ave
- 49 N Evanston Ave
- 47 N Evanston Ave
- 101 N Evanston Ave
- 43 N Evanston Ave
- 107 N Evanston Ave
- 111 N Evanston Ave
- 54 Steel St
- 52 Steel St
- 35 N Evanston Ave
- 35 N Evanston Ave
- 113 N Evanston Ave
- 52 N Evanston Ave
- 48 Steel St
- 102 Steel St
- 44 N Evanston Ave
- 48 N Evanston Ave
- 44 Steel St
- 40 N Evanston Ave
- 56 N Evanston Ave
- 115 N Evanston Ave