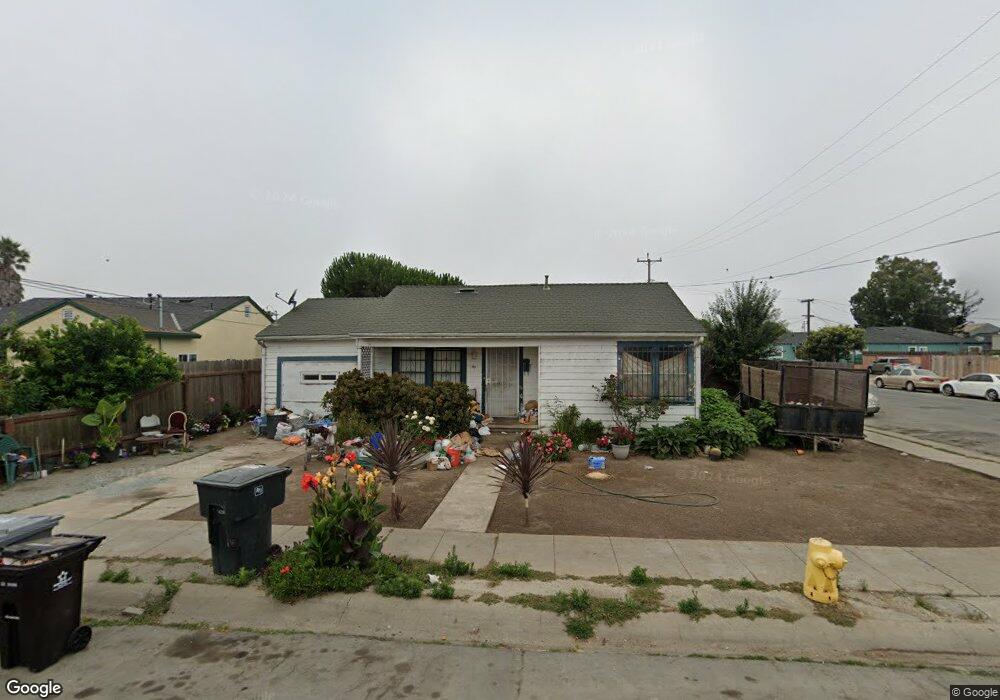
49 N Filice St Salinas, CA 93905
East Salinas NeighborhoodEstimated Value: $416,000 - $618,000
2
Beds
1
Bath
705
Sq Ft
$750/Sq Ft
Est. Value
About This Home
This home is located at 49 N Filice St, Salinas, CA 93905 and is currently estimated at $528,550, approximately $749 per square foot. 49 N Filice St is a home located in Monterey County with nearby schools including Sherwood Elementary School, Los Padres Elementary School, and Washington Middle School.
Ownership History
Date
Name
Owned For
Owner Type
Purchase Details
Closed on
Sep 23, 2025
Sold by
Yee Nancy N
Bought by
Nancy N Yee Living Trust and Yee
Current Estimated Value
Purchase Details
Closed on
Apr 19, 2000
Sold by
Yee Choy Nancy N and Yee Tam Mary
Bought by
Yee Yee Nancy N Nancy N and Yee Tam Mary
Purchase Details
Closed on
Nov 28, 1995
Sold by
Min Yee Thyn and Yee Chan Kam Y
Bought by
Choy Nancy N and Tam Mary Yee
Create a Home Valuation Report for This Property
The Home Valuation Report is an in-depth analysis detailing your home's value as well as a comparison with similar homes in the area
Home Values in the Area
Average Home Value in this Area
Purchase History
| Date | Buyer | Sale Price | Title Company |
|---|---|---|---|
| Nancy N Yee Living Trust | -- | None Listed On Document | |
| Yee Yee Nancy N Nancy N | -- | -- | |
| Choy Nancy N | -- | -- | |
| Yee Wayne | -- | -- |
Source: Public Records
Tax History Compared to Growth
Tax History
| Year | Tax Paid | Tax Assessment Tax Assessment Total Assessment is a certain percentage of the fair market value that is determined by local assessors to be the total taxable value of land and additions on the property. | Land | Improvement |
|---|---|---|---|---|
| 2025 | $392 | $36,616 | $16,959 | $19,657 |
| 2024 | $392 | $35,899 | $16,627 | $19,272 |
| 2023 | $378 | $35,196 | $16,301 | $18,895 |
| 2022 | $360 | $34,507 | $15,982 | $18,525 |
| 2021 | $345 | $33,831 | $15,669 | $18,162 |
| 2020 | $336 | $33,485 | $15,509 | $17,976 |
| 2019 | $329 | $32,829 | $15,205 | $17,624 |
| 2018 | $320 | $32,186 | $14,907 | $17,279 |
| 2017 | $319 | $31,556 | $14,615 | $16,941 |
| 2016 | $317 | $30,938 | $14,329 | $16,609 |
| 2015 | $318 | $30,474 | $14,114 | $16,360 |
| 2014 | $298 | $29,878 | $13,838 | $16,040 |
Source: Public Records
Map
Nearby Homes
- 129 N Filice St
- 320 N Sanborn Rd
- 487 E Market St
- 150 Kern St Unit 39
- 150 Kern St Unit 40
- 158 Kern St Unit 11
- 7 Midway Ave
- 166 Kern St Unit 19
- 11 Hill Cir
- 933 Acosta Plaza Unit 35
- 914 Acosta Plaza Unit 32
- 1101 Kimmel St
- 912 Acosta Plaza Unit 11
- 709 Gee St
- 1 Santa Lucia Ave
- 230 Paloma Ave
- 710 Fairmont Dr
- 166 Afton Rd
- 230 Martella St
- 1413 Wiren St
- 47 N Filice St
- 728 Jefferson St
- 45 N Filice St
- 63 N Filice St
- 724 Jefferson St
- 56 N Filice St
- 52 N Filice St
- 43 N Filice St
- 62 N Filice St
- 65 N Filice St
- 720 Jefferson St
- 729 Jefferson St
- 46 N Filice St
- 64 N Filice St
- 44 N Filice St
- 731 East St
- 716 Jefferson St Unit 716 716-A 716-B
- 716 Jefferson St
- 725 Jefferson St
- 35 N Filice St