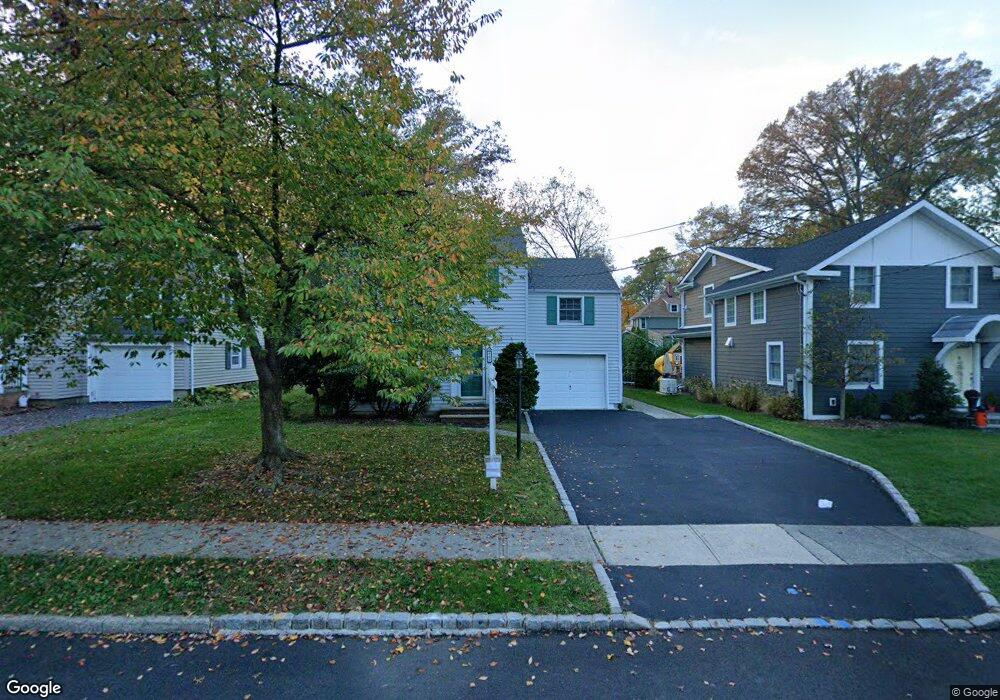
49 N Summit Ave Unit A Chatham, NJ 07928
Estimated Value: $889,000 - $1,341,000
2
Beds
4
Baths
1,767
Sq Ft
$662/Sq Ft
Est. Value
About This Home
This home is located at 49 N Summit Ave Unit A, Chatham, NJ 07928 and is currently estimated at $1,169,621, approximately $661 per square foot. 49 N Summit Ave Unit A is a home located in Morris County with nearby schools including Chatham High School, St. Patrick School, and ECLC of New Jersey.
Ownership History
Date
Name
Owned For
Owner Type
Purchase Details
Closed on
Jan 21, 2021
Sold by
Li Yong and Liu Xin
Bought by
Glass Nicholas and Arlinghaus Meghan
Current Estimated Value
Home Financials for this Owner
Home Financials are based on the most recent Mortgage that was taken out on this home.
Original Mortgage
$665,000
Outstanding Balance
$592,887
Interest Rate
2.65%
Mortgage Type
New Conventional
Estimated Equity
$576,734
Purchase Details
Closed on
Mar 29, 2010
Sold by
Mah Wesley and Hauck Mah Barbara
Bought by
Li Yong and Lieu Xin
Home Financials for this Owner
Home Financials are based on the most recent Mortgage that was taken out on this home.
Original Mortgage
$485,600
Interest Rate
4.94%
Mortgage Type
Stand Alone First
Purchase Details
Closed on
Oct 13, 1995
Sold by
Briskman Neil M and Donahoo Kathleene K
Bought by
Mah Wesley and Hauck Mah Barbara
Create a Home Valuation Report for This Property
The Home Valuation Report is an in-depth analysis detailing your home's value as well as a comparison with similar homes in the area
Home Values in the Area
Average Home Value in this Area
Purchase History
| Date | Buyer | Sale Price | Title Company |
|---|---|---|---|
| Glass Nicholas | $710,000 | Westcor Land Title Ins Co | |
| Li Yong | $607,000 | Chicago Title Insurance Co | |
| Mah Wesley | $320,000 | Chicago Title Insurance Co |
Source: Public Records
Mortgage History
| Date | Status | Borrower | Loan Amount |
|---|---|---|---|
| Open | Glass Nicholas | $665,000 | |
| Previous Owner | Li Yong | $485,600 |
Source: Public Records
Tax History Compared to Growth
Tax History
| Year | Tax Paid | Tax Assessment Tax Assessment Total Assessment is a certain percentage of the fair market value that is determined by local assessors to be the total taxable value of land and additions on the property. | Land | Improvement |
|---|---|---|---|---|
| 2025 | $13,201 | $815,400 | $543,800 | $271,600 |
| 2024 | $12,671 | $815,400 | $543,800 | $271,600 |
| 2023 | $12,671 | $815,400 | $543,800 | $271,600 |
| 2022 | $11,734 | $549,100 | $378,800 | $170,300 |
| 2021 | $11,734 | $549,100 | $378,800 | $170,300 |
| 2020 | $11,635 | $549,100 | $378,800 | $170,300 |
| 2019 | $11,553 | $549,100 | $378,800 | $170,300 |
| 2018 | $11,229 | $549,100 | $378,800 | $170,300 |
| 2017 | $10,905 | $549,100 | $378,800 | $170,300 |
| 2016 | $10,620 | $549,100 | $378,800 | $170,300 |
| 2015 | $10,493 | $549,100 | $378,800 | $170,300 |
| 2014 | $10,416 | $549,100 | $378,800 | $170,300 |
Source: Public Records
Map
Nearby Homes
- 25 Roosevelt Ave
- 102 Center Ave
- 30 Hillside Ave
- 151 Center Ave
- 17 Coleman Ave W
- 1 John St
- 149 N Hillside Ave
- 57 Parrott Mill Rd
- 47 Red Rd
- 380 Main St Unit 5
- 5 Woodland Rd
- 2 Rose Ln
- 24 Bridge St
- 128 Fairmount Ave
- 38 Essex Rd
- 44 Brooklake Rd
- 37 Plain St
- 3 Durwood Place
- 14 Schindler Ct Unit F27
- 85 Kings Rd
- 49 N Summit Ave
- 47 N Summit Ave
- 51 N Summit Ave
- 53 N Summit Ave
- 45 N Summit Ave
- 52 N Hillside Ave
- 50 N Hillside Ave
- 54 N Hillside Ave
- 43 N Summit Ave
- 55 N Summit Ave
- 56 N Hillside Ave
- 50 N Summit Ave
- 52 N Summit Ave
- 48 N Summit Ave
- 54 N Summit Ave
- 57 N Summit Ave
- 41 N Summit Ave
- 44 N Hillside Ave
- 60 N Hillside Ave
- 56 N Summit Ave