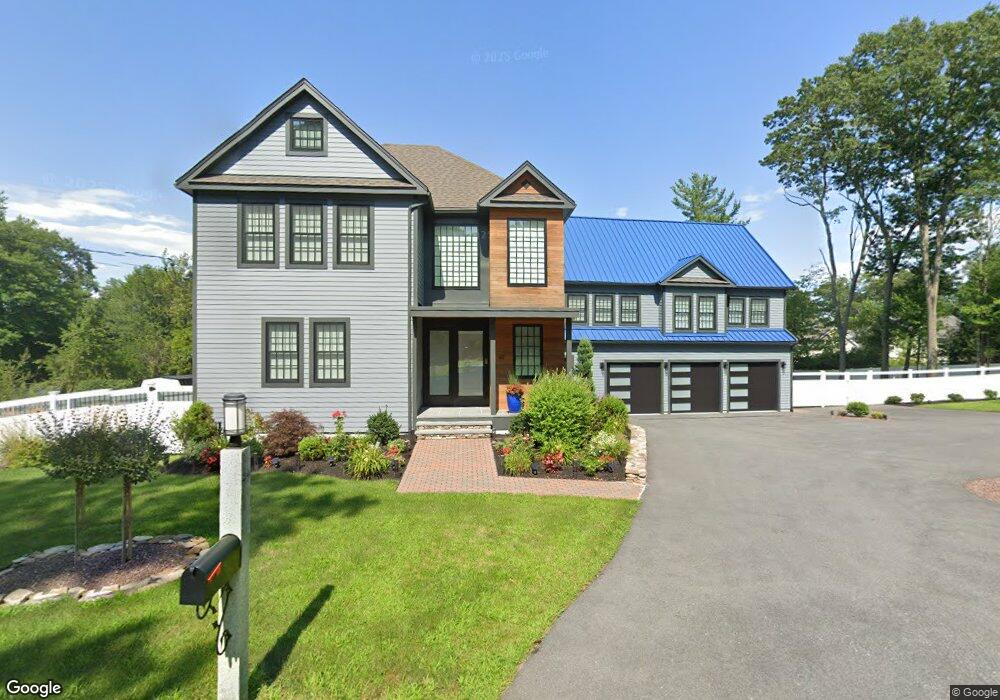
49 North St Unit ELM Andover, MA 01810
Far West Andover NeighborhoodEstimated Value: $560,859 - $670,000
3
Beds
1
Bath
1,002
Sq Ft
$612/Sq Ft
Est. Value
About This Home
This home is located at 49 North St Unit ELM, Andover, MA 01810 and is currently estimated at $613,715, approximately $612 per square foot. 49 North St Unit ELM is a home located in Essex County with nearby schools including High Plain Elementary School, Wood Hill Middle School, and Andover High School.
Ownership History
Date
Name
Owned For
Owner Type
Purchase Details
Closed on
Apr 8, 2022
Sold by
Gill Guy and Gill Daphne
Bought by
Hyppolite Stepherly J
Current Estimated Value
Home Financials for this Owner
Home Financials are based on the most recent Mortgage that was taken out on this home.
Original Mortgage
$465,000
Outstanding Balance
$433,530
Interest Rate
3.89%
Mortgage Type
Purchase Money Mortgage
Estimated Equity
$180,185
Purchase Details
Closed on
Dec 10, 2010
Sold by
Gill Guy and Gill James
Bought by
Gill Guy and Gill Daphne
Purchase Details
Closed on
Nov 20, 2007
Sold by
Peterson Carol and Stonier James W
Bought by
Gill Guy and Gill James
Home Financials for this Owner
Home Financials are based on the most recent Mortgage that was taken out on this home.
Original Mortgage
$273,035
Interest Rate
6.41%
Mortgage Type
Purchase Money Mortgage
Purchase Details
Closed on
Apr 30, 2002
Sold by
Milley Steven J
Bought by
Salomon-Demoraes R
Purchase Details
Closed on
Jan 9, 1997
Sold by
Kaleel Michael M
Bought by
Milley Steven J
Create a Home Valuation Report for This Property
The Home Valuation Report is an in-depth analysis detailing your home's value as well as a comparison with similar homes in the area
Home Values in the Area
Average Home Value in this Area
Purchase History
| Date | Buyer | Sale Price | Title Company |
|---|---|---|---|
| Hyppolite Stepherly J | $490,000 | None Available | |
| Gill Guy | -- | -- | |
| Gill Guy | -- | -- | |
| Gill Guy | -- | -- | |
| Gill Guy | $277,500 | -- | |
| Gill Guy | $277,500 | -- | |
| Gill Guy | $277,500 | -- | |
| Salomon-Demoraes R | $315,000 | -- | |
| Salomon-Demoraes R | $315,000 | -- | |
| Milley Steven J | $130,000 | -- | |
| Milley Steven J | $130,000 | -- |
Source: Public Records
Mortgage History
| Date | Status | Borrower | Loan Amount |
|---|---|---|---|
| Open | Hyppolite Stepherly J | $465,000 | |
| Previous Owner | Gill Guy | $273,035 |
Source: Public Records
Tax History Compared to Growth
Tax History
| Year | Tax Paid | Tax Assessment Tax Assessment Total Assessment is a certain percentage of the fair market value that is determined by local assessors to be the total taxable value of land and additions on the property. | Land | Improvement |
|---|---|---|---|---|
| 2024 | $6,221 | $483,000 | $263,900 | $219,100 |
| 2023 | $6,442 | $471,600 | $274,800 | $196,800 |
| 2022 | $6,024 | $412,600 | $232,800 | $179,800 |
| 2021 | $5,751 | $376,100 | $211,600 | $164,500 |
| 2020 | $5,513 | $367,300 | $206,500 | $160,800 |
| 2019 | $5,450 | $356,900 | $200,500 | $156,400 |
| 2018 | $5,196 | $332,200 | $189,000 | $143,200 |
| 2017 | $4,967 | $327,200 | $185,300 | $141,900 |
| 2016 | $4,851 | $327,300 | $185,300 | $142,000 |
| 2015 | $4,665 | $311,600 | $178,200 | $133,400 |
Source: Public Records
Map
Nearby Homes
- 23 Mount Vernon Cir
- 0
- 750 Brookside Dr Unit G
- 11 Devonshire St
- 96 Beacon St
- 5 Marc Ln
- 37 Tewksbury St Unit 39
- 54 Amherst St
- 450 Riverside Dr Unit 1
- 25 Clubview Dr Unit 25
- 439-443 Riverside Dr
- 15 Beaconsfield St
- 8 Packard St
- 21 Clubview Dr Unit 21
- 42 Beresford St
- 33 Jefferson St
- 19 Oregon Ave
- 11 W Hawley St
- 629 Andover St
- 5 W Kenneth St