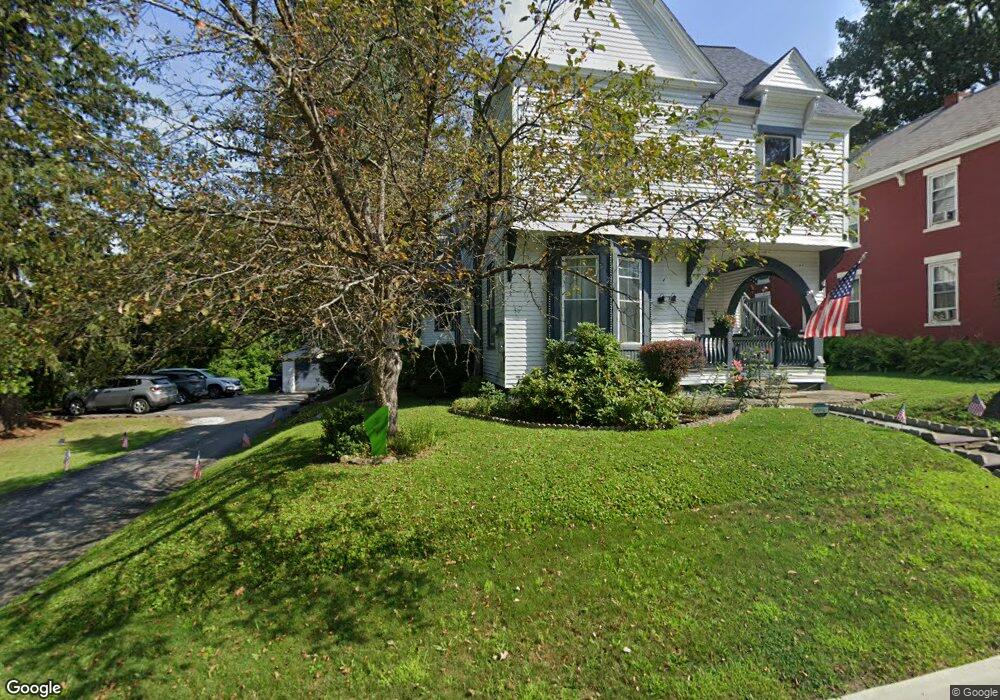
49 North St Rutland, VT 05701
Estimated Value: $260,000 - $296,000
5
Beds
2
Baths
--
Sq Ft
0.38
Acres
About This Home
This home is located at 49 North St, Rutland, VT 05701 and is currently estimated at $279,017. 49 North St is a home located in Rutland County with nearby schools including Rutland Intermediate School, Rutland Middle School, and Rutland Senior High School.
Ownership History
Date
Name
Owned For
Owner Type
Purchase Details
Closed on
May 24, 2022
Sold by
Barbiero Seth
Bought by
Munger Jaime M and Munger Megan
Current Estimated Value
Purchase Details
Closed on
Sep 28, 2017
Sold by
Courtney Nancy
Bought by
Barbiero Seth
Purchase Details
Closed on
Jul 19, 2006
Sold by
Courtney Nancy
Bought by
49 North Street Rutland Llc
Purchase Details
Closed on
Jan 17, 2001
Sold by
Courtney Nancy and Buteau Bernard F
Bought by
Courtney Nancy
Purchase Details
Closed on
Jun 13, 2000
Sold by
Ruby David E and Ruby Karen E
Bought by
Courtney Nancy and Buteau Bernard F
Purchase Details
Closed on
Jun 20, 1989
Sold by
Godfrey-Ruby Karen E
Bought by
Ruby David E and Ruby Karen M
Purchase Details
Closed on
Aug 12, 1988
Sold by
Turgeon Daniel J and Turgeon Stacy D
Bought by
Godfrey Karen E
Purchase Details
Closed on
May 15, 1987
Sold by
Turgeon Daniel J and Turgeon Stacy D
Bought by
Turgeon Daniel J and Turgeon Stacy D
Create a Home Valuation Report for This Property
The Home Valuation Report is an in-depth analysis detailing your home's value as well as a comparison with similar homes in the area
Home Values in the Area
Average Home Value in this Area
Purchase History
| Date | Buyer | Sale Price | Title Company |
|---|---|---|---|
| Munger Jaime M | $199,900 | -- | |
| Munger Jaime M | $199,900 | -- | |
| Barbiero Seth | $30,000 | -- | |
| Barbiero Seth | $30,000 | -- | |
| 49 North Street Rutland Llc | -- | -- | |
| 49 North Street Rutland Llc | -- | -- | |
| Courtney Nancy | -- | -- | |
| Courtney Nancy | -- | -- | |
| Courtney Nancy | $99,000 | -- | |
| Courtney Nancy | $99,000 | -- | |
| Ruby David E | -- | -- | |
| Godfrey Karen E | $118,500 | -- | |
| Turgeon Daniel J | -- | -- | |
| Ruby David E | -- | -- | |
| Godfrey Karen E | $118,500 | -- | |
| Turgeon Daniel J | -- | -- |
Source: Public Records
Tax History Compared to Growth
Tax History
| Year | Tax Paid | Tax Assessment Tax Assessment Total Assessment is a certain percentage of the fair market value that is determined by local assessors to be the total taxable value of land and additions on the property. | Land | Improvement |
|---|---|---|---|---|
| 2024 | -- | $155,500 | $41,500 | $114,000 |
| 2023 | -- | $155,500 | $41,500 | $114,000 |
| 2022 | $5,073 | $146,900 | $41,500 | $105,400 |
| 2021 | $5,137 | $146,900 | $41,500 | $105,400 |
| 2020 | $5,091 | $146,900 | $41,500 | $105,400 |
| 2019 | $4,965 | $146,900 | $41,500 | $105,400 |
| 2018 | $4,972 | $146,900 | $41,500 | $105,400 |
| 2017 | $4,629 | $146,900 | $41,500 | $105,400 |
| 2016 | $4,614 | $146,900 | $41,500 | $105,400 |
Source: Public Records
Map
Nearby Homes