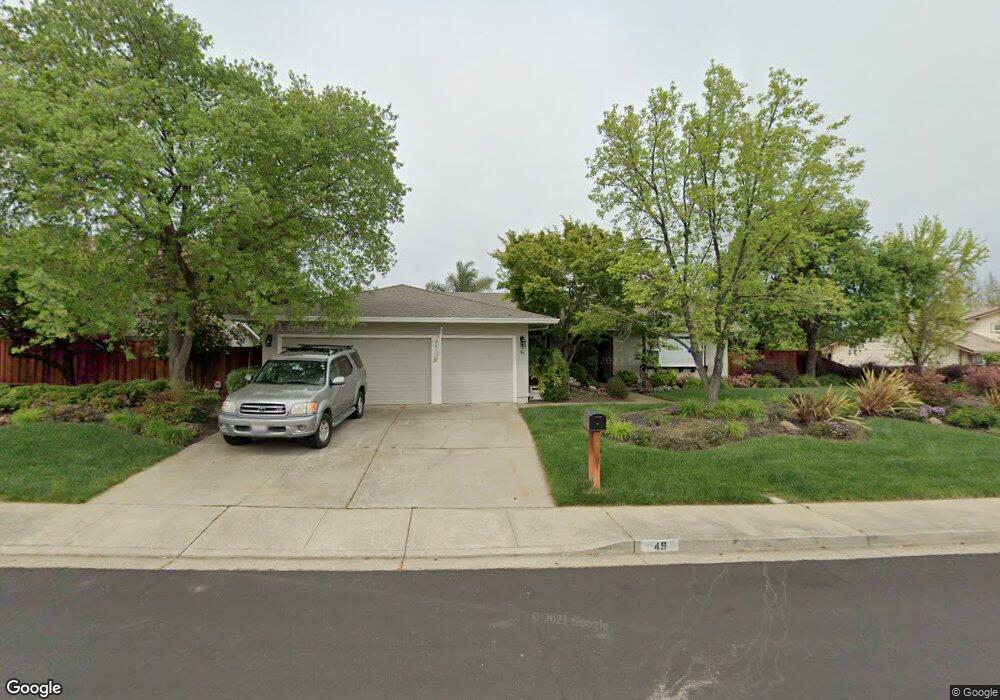
49 Nottingham Cir Clayton, CA 94517
Estimated Value: $1,113,000 - $1,184,000
4
Beds
2
Baths
2,277
Sq Ft
$508/Sq Ft
Est. Value
About This Home
This home is located at 49 Nottingham Cir, Clayton, CA 94517 and is currently estimated at $1,155,634, approximately $507 per square foot. 49 Nottingham Cir is a home located in Contra Costa County with nearby schools including Mt. Diablo Elementary School, Diablo View Middle School, and College Park High School.
Ownership History
Date
Name
Owned For
Owner Type
Purchase Details
Closed on
Nov 15, 2018
Sold by
Robinson Owen Iii John Brinley and Robinson Owen Kirsten
Bought by
Robinson Owen Iii John Brinley and Robinson Owen Kirsten
Current Estimated Value
Purchase Details
Closed on
Aug 23, 2001
Sold by
Bockman Donald William and Bockman Denise Lynne
Bought by
Owen John Brinley and Owen Kirsten Robinson
Home Financials for this Owner
Home Financials are based on the most recent Mortgage that was taken out on this home.
Original Mortgage
$387,200
Outstanding Balance
$150,385
Interest Rate
7.09%
Mortgage Type
Purchase Money Mortgage
Estimated Equity
$1,005,249
Purchase Details
Closed on
Jun 24, 1996
Sold by
Demond Martin T
Bought by
Bockman Donald William and Bockman Denise Lynne
Home Financials for this Owner
Home Financials are based on the most recent Mortgage that was taken out on this home.
Original Mortgage
$246,000
Interest Rate
8.37%
Mortgage Type
Purchase Money Mortgage
Purchase Details
Closed on
Nov 21, 1995
Sold by
Demond Becky G and Demond Martin T
Bought by
Demond Martin T
Create a Home Valuation Report for This Property
The Home Valuation Report is an in-depth analysis detailing your home's value as well as a comparison with similar homes in the area
Home Values in the Area
Average Home Value in this Area
Purchase History
| Date | Buyer | Sale Price | Title Company |
|---|---|---|---|
| Robinson Owen Iii John Brinley | -- | None Available | |
| Owen John Brinley | $484,000 | North American Title Co | |
| Bockman Donald William | $259,000 | Fidelity National Title Co | |
| Demond Martin T | -- | -- |
Source: Public Records
Mortgage History
| Date | Status | Borrower | Loan Amount |
|---|---|---|---|
| Open | Owen John Brinley | $387,200 | |
| Previous Owner | Bockman Donald William | $246,000 |
Source: Public Records
Tax History
| Year | Tax Paid | Tax Assessment Tax Assessment Total Assessment is a certain percentage of the fair market value that is determined by local assessors to be the total taxable value of land and additions on the property. | Land | Improvement |
|---|---|---|---|---|
| 2025 | $9,166 | $714,996 | $386,748 | $328,248 |
| 2024 | $8,769 | $700,977 | $379,165 | $321,812 |
| 2023 | $8,769 | $687,233 | $371,731 | $315,502 |
| 2022 | $8,650 | $673,759 | $364,443 | $309,316 |
| 2021 | $8,439 | $660,549 | $357,298 | $303,251 |
| 2019 | $8,273 | $640,958 | $346,701 | $294,257 |
| 2018 | $7,964 | $628,391 | $339,903 | $288,488 |
| 2017 | $7,703 | $616,071 | $333,239 | $282,832 |
| 2016 | $7,498 | $603,992 | $326,705 | $277,287 |
| 2015 | $7,418 | $594,920 | $321,798 | $273,122 |
| 2014 | $7,296 | $583,267 | $315,495 | $267,772 |
Source: Public Records
Map
Nearby Homes
- 5722 Roanwood Way
- 5817 Mitchell Canyon Ct
- 5900 High St
- 5555 Maryland Dr
- 1506 N El Camino Dr
- 1346 Montana Dr
- 57 Karkin Place
- 35 Jalalon Place
- 500 Douglas Rd
- 5535 Merritt Dr
- 1833 Camino Estrada
- 321 Semillon Cir
- 218 Mountaire Cir
- 5537 Pamplona Ct
- 5506 Nebraska Dr
- 5454 Anselmo Ct
- 5492 Roundtree Dr Unit A
- 5460 Concord Blvd Unit E4
- 1897 Camino Estrada
- 41 Mt Shasta Place
- 43 Nottingham Cir
- 55 Nottingham Cir
- 20 Atchinson Stage Place
- 13 Atchinson Stage Place
- 62 Nottingham Cir
- 68 Nottingham Cir
- 56 Nottingham Cir
- 74 Nottingham Cir
- 37 Nottingham Cir
- 61 Nottingham Cir
- 26 Atchinson Stage Place
- 7 Atchinson Stage Place
- 80 Nottingham Cir
- 5832 Verna Way E
- 20 Atchinson Stage Ct
- 32 Atchinson Stage Place
- 67 Nottingham Cir
- 1 Atchinson Stage Place
- 26 Atchinson Stage Ct
- 31 Nottingham Cir
Your Personal Tour Guide
Ask me questions while you tour the home.