Estimated Value: $61,000
About This Home
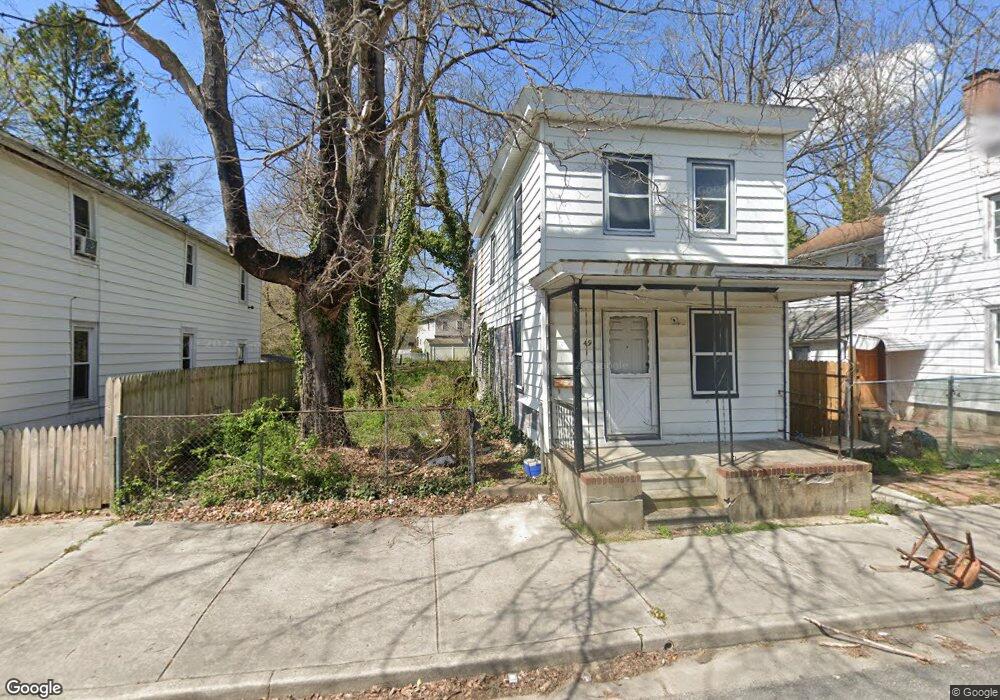
This home is located at 49 Olive St, Salem, NJ 08079 and is currently priced at $61,000, approximately $45 per square foot. 49 Olive St is a home located in Salem County with nearby schools including John Fenwick Elementary School, Salem Middle School, and Salem High School.
Ownership History
We collect this data history from publicly available records. To have your information removed, we recommend requesting removal directly through your county’s website.
Purchase Details
Purchase Details
Purchase Details
Purchase Details
Home Values in the Area
Average Home Value in this Area
Purchase History
We collect this data history from publicly available records. To have your information removed, we recommend requesting removal directly through your county’s website.
| Date | Buyer | Sale Price | Title Company |
|---|---|---|---|
| -- | -- | ||
| $18,500 | -- | ||
| $13,000 | -- | ||
| -- | -- |
Tax History
We collect this data history from publicly available records. To have your information removed, we recommend requesting removal directly through your county’s website.
| Year | Tax Paid | Tax Assessment Tax Assessment Total Assessment is a certain percentage of the fair market value that is determined by local assessors to be the total taxable value of land and additions on the property. | Land | Improvement |
|---|---|---|---|---|
| 2025 | $1,289 | $16,400 | $9,100 | $7,300 |
| 2024 | $1,289 | $16,400 | $9,100 | $7,300 |
| 2023 | $1,289 | $16,400 | $9,100 | $7,300 |
| 2022 | $1,233 | $16,400 | $9,100 | $7,300 |
| 2021 | $1,190 | $16,400 | $9,100 | $7,300 |
| 2020 | $1,166 | $16,400 | $9,100 | $7,300 |
| 2019 | $1,159 | $16,400 | $9,100 | $7,300 |
| 2018 | $1,134 | $16,400 | $9,100 | $7,300 |
| 2017 | $1,120 | $16,400 | $9,100 | $7,300 |
| 2016 | $1,014 | $25,900 | $16,700 | $9,200 |
| 2015 | $1,001 | $25,900 | $16,700 | $9,200 |
| 2014 | $996 | $25,900 | $16,700 | $9,200 |
Map
- 35 Eakin St
- 64 Union St
- 235 Sinnickson St
- 233 Sinnickson St
- 256-258 258 Sinnickson St
- 78 Walnut St
- 6 Olive St
- 60 62 Walnut St
- 79 Walnut St
- 67 Walnut St
- 315 317 E Broadway
- 24 Elm St
- 210 Wesley St
- 46 Walnut St
- 303 E Broadway
- 334 336 E Broadway
- 371 E Broadway
- 296 298 E Broadway E
- 369 E Broadway
- 12 Church St
Ask me questions while you tour the home.