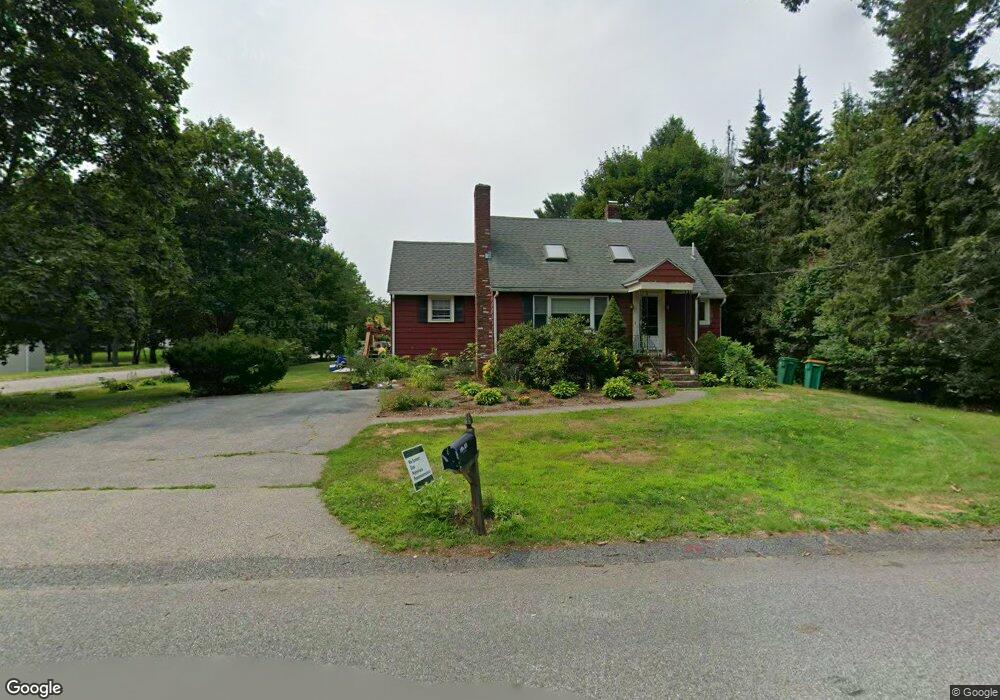
49 Otis St Mansfield, MA 02048
Estimated Value: $529,000 - $626,000
1
Bed
1
Bath
1,268
Sq Ft
$449/Sq Ft
Est. Value
About This Home
This home is located at 49 Otis St, Mansfield, MA 02048 and is currently estimated at $569,773, approximately $449 per square foot. 49 Otis St is a home located in Bristol County with nearby schools including Everett W. Robinson Elementary School, Jordan/Jackson Elementary School, and Harold L. Qualters Middle School.
Ownership History
Date
Name
Owned For
Owner Type
Purchase Details
Closed on
Aug 19, 2002
Sold by
Nogueira Mark T and Nogueira Kathryn E
Bought by
Mowles Brian J and Mowles Denise A
Current Estimated Value
Home Financials for this Owner
Home Financials are based on the most recent Mortgage that was taken out on this home.
Original Mortgage
$263,900
Outstanding Balance
$112,148
Interest Rate
6.61%
Mortgage Type
Purchase Money Mortgage
Estimated Equity
$457,625
Purchase Details
Closed on
Nov 21, 1989
Sold by
Warnick Karl L
Bought by
Harrington & Matto Co
Create a Home Valuation Report for This Property
The Home Valuation Report is an in-depth analysis detailing your home's value as well as a comparison with similar homes in the area
Home Values in the Area
Average Home Value in this Area
Purchase History
| Date | Buyer | Sale Price | Title Company |
|---|---|---|---|
| Mowles Brian J | $266,000 | -- | |
| Harrington & Matto Co | $262,500 | -- |
Source: Public Records
Mortgage History
| Date | Status | Borrower | Loan Amount |
|---|---|---|---|
| Open | Harrington & Matto Co | $263,900 | |
| Previous Owner | Harrington & Matto Co | $118,500 | |
| Previous Owner | Harrington & Matto Co | $20,000 |
Source: Public Records
Tax History Compared to Growth
Tax History
| Year | Tax Paid | Tax Assessment Tax Assessment Total Assessment is a certain percentage of the fair market value that is determined by local assessors to be the total taxable value of land and additions on the property. | Land | Improvement |
|---|---|---|---|---|
| 2025 | $6,091 | $462,500 | $229,100 | $233,400 |
| 2024 | $6,095 | $451,500 | $229,100 | $222,400 |
| 2023 | $6,060 | $430,100 | $229,100 | $201,000 |
| 2022 | $5,857 | $386,100 | $212,100 | $174,000 |
| 2021 | $2,742 | $353,900 | $185,600 | $168,300 |
| 2020 | $5,101 | $332,100 | $176,700 | $155,400 |
| 2019 | $4,630 | $304,200 | $147,300 | $156,900 |
| 2018 | $4,271 | $293,000 | $140,400 | $152,600 |
| 2017 | $4,124 | $274,600 | $136,400 | $138,200 |
| 2016 | $3,831 | $248,600 | $129,900 | $118,700 |
| 2015 | $3,811 | $245,900 | $129,900 | $116,000 |
Source: Public Records
Map
Nearby Homes
- 176 Elm St
- 4 Buckskin Dr
- 2 Oak St Unit 2D
- 2 Oak St Unit 2A
- 2 Oak St Unit 2C
- 2 Oak St Unit 2B
- 150 Gilbert St
- 37 Oakleaf Dr
- 451R Gilbert St
- 255 Mckeon Dr
- 24 Maverick Dr
- 250 Mansfield Ave Unit 66
- 14 Country Club Way
- 231 Spring St
- 15 Reservoir St Unit 44
- 450 West St
- 196 Donald Tennant Cir
- 157 Mansfield Ave Unit 14
- 18 Columbine Rd
- 115 Westfield Dr