Estimated Value: $891,000 - $1,073,000
4
Beds
2
Baths
2,017
Sq Ft
$476/Sq Ft
Est. Value
About This Home
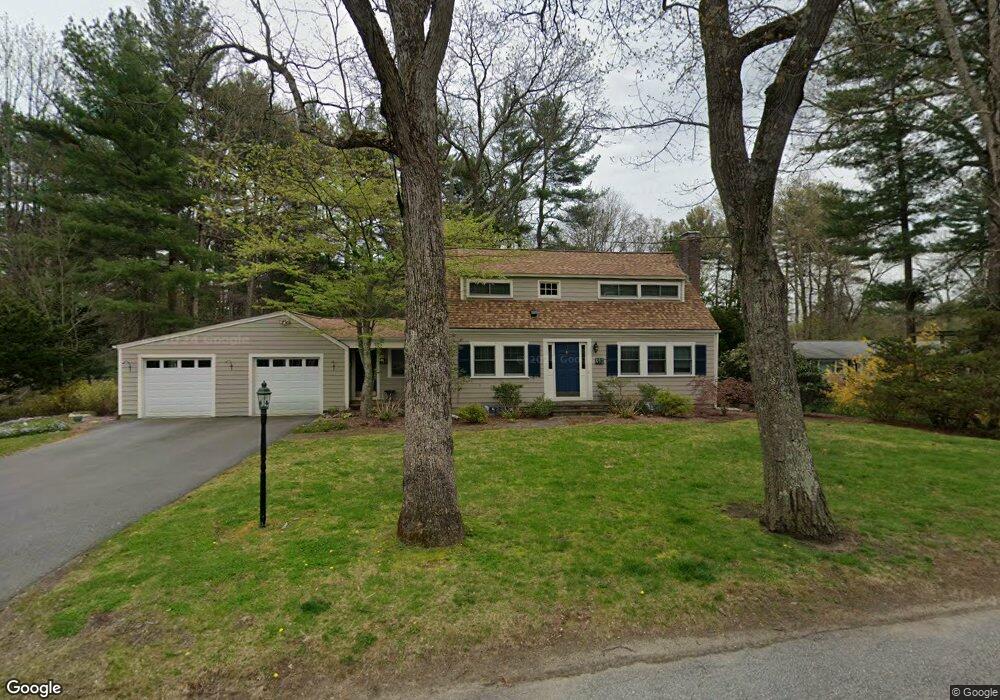
This home is located at 49 Quaboag Rd, Acton, MA 01720 and is currently estimated at $960,301, approximately $476 per square foot. 49 Quaboag Rd is a home located in Middlesex County with nearby schools including Acton-Boxborough Regional High School and Oak Meadow Montessori School.
Ownership History
Date
Name
Owned For
Owner Type
Purchase Details
Closed on
Jun 25, 2014
Sold by
Ames William and Knibbe Paulina
Bought by
Knibbe 2004 Paulina S and Knibbe Paulina S
Current Estimated Value
Purchase Details
Closed on
Apr 29, 2011
Sold by
Bodnar Keith E and Bodnar Kimberly A
Bought by
Ames William and Knibbe Paulina
Purchase Details
Closed on
Mar 1, 2005
Sold by
Russo Tonya M
Bought by
Bodnar Keith E and Bodnar Kimberly Ann
Home Financials for this Owner
Home Financials are based on the most recent Mortgage that was taken out on this home.
Original Mortgage
$428,000
Interest Rate
5.73%
Mortgage Type
Purchase Money Mortgage
Purchase Details
Closed on
Oct 27, 2004
Sold by
Russo Matthew T
Bought by
Russo Tonya M
Purchase Details
Closed on
Feb 9, 1996
Sold by
Brown Bradford T and Brown Jane S
Bought by
Russo Matthew T and Russo Thomas J
Create a Home Valuation Report for This Property
The Home Valuation Report is an in-depth analysis detailing your home's value as well as a comparison with similar homes in the area
Home Values in the Area
Average Home Value in this Area
Purchase History
| Date | Buyer | Sale Price | Title Company |
|---|---|---|---|
| Knibbe 2004 Paulina S | -- | -- | |
| Ames William | $519,000 | -- | |
| Bodnar Keith E | $535,000 | -- | |
| Bodnar Keith E | $535,000 | -- | |
| Russo Tonya M | -- | -- | |
| Russo Matthew T | $254,000 | -- |
Source: Public Records
Mortgage History
| Date | Status | Borrower | Loan Amount |
|---|---|---|---|
| Previous Owner | Russo Matthew T | $400,000 | |
| Previous Owner | Bodnar Keith E | $428,000 | |
| Previous Owner | Russo Matthew T | $235,000 |
Source: Public Records
Tax History
| Year | Tax Paid | Tax Assessment Tax Assessment Total Assessment is a certain percentage of the fair market value that is determined by local assessors to be the total taxable value of land and additions on the property. | Land | Improvement |
|---|---|---|---|---|
| 2025 | $13,883 | $809,500 | $313,600 | $495,900 |
| 2024 | $13,103 | $786,000 | $313,600 | $472,400 |
| 2023 | $13,300 | $757,400 | $285,000 | $472,400 |
| 2022 | $11,956 | $614,700 | $247,800 | $366,900 |
| 2021 | $11,642 | $575,500 | $229,500 | $346,000 |
| 2020 | $10,730 | $557,700 | $229,500 | $328,200 |
| 2019 | $10,038 | $518,200 | $229,500 | $288,700 |
| 2018 | $9,853 | $508,400 | $229,500 | $278,900 |
| 2017 | $9,690 | $508,400 | $229,500 | $278,900 |
| 2016 | $9,163 | $476,500 | $229,500 | $247,000 |
| 2015 | $8,273 | $434,300 | $229,500 | $204,800 |
| 2014 | $8,091 | $416,000 | $229,500 | $186,500 |
Source: Public Records
Map
Nearby Homes
- 5 Perkins Ln
- 20 Joseph Reed Ln
- 79 Charter Rd
- 235 Arlington St
- 4 Littlefield Rd
- 60 Nashoba Rd
- 246 Main St Unit 2
- 18 Hayward Rd
- 7 Kelley Rd
- 92 Willow St Unit 3
- 92 Willow St Unit 2
- 90 Willow St Unit 1
- 11 Braebrook
- 184 Main St Unit 3
- 46 Taylor Rd
- 4 Omega Way
- 33 Meadowbrook Rd
- 25 Nylander Way
- 491 Main St
- 129 Main St Unit 129
Your Personal Tour Guide
Ask me questions while you tour the home.