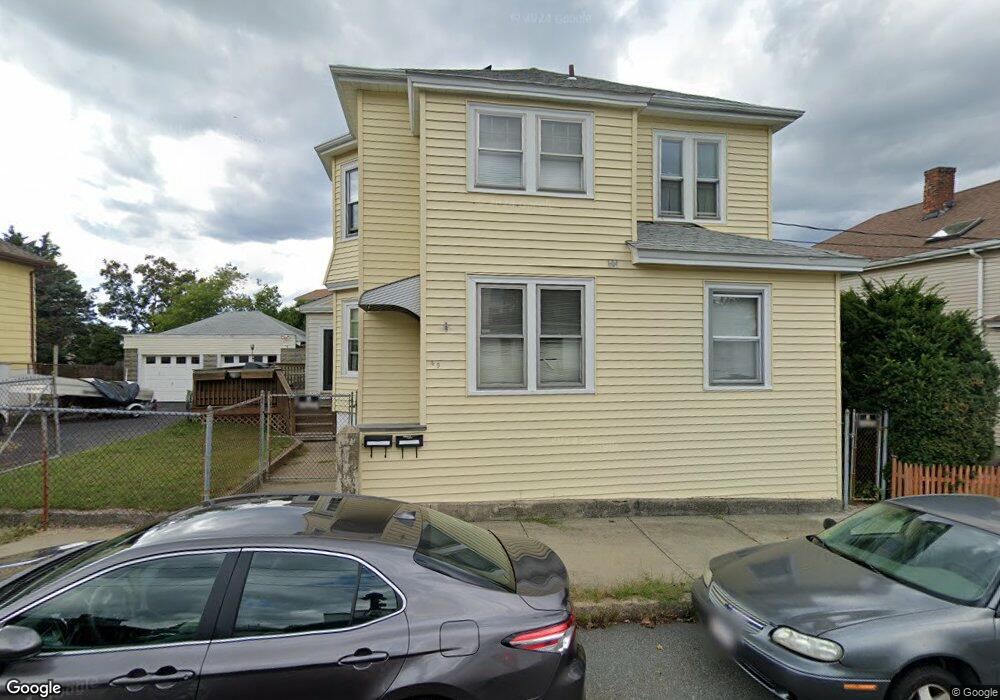
49 Queen St Fall River, MA 02724
Sandy Beach NeighborhoodEstimated Value: $426,660 - $579,000
4
Beds
2
Baths
1,908
Sq Ft
$270/Sq Ft
Est. Value
About This Home
This home is located at 49 Queen St, Fall River, MA 02724 and is currently estimated at $514,415, approximately $269 per square foot. 49 Queen St is a home located in Bristol County with nearby schools including Carlton M. Viveiros Elementary School, Matthew J. Kuss Middle School, and B M C Durfee High School.
Ownership History
Date
Name
Owned For
Owner Type
Purchase Details
Closed on
Nov 2, 2010
Sold by
Mendoza Scott J and Mendoza Stephanie L
Bought by
Sullivan Lisa A
Current Estimated Value
Home Financials for this Owner
Home Financials are based on the most recent Mortgage that was taken out on this home.
Original Mortgage
$212,143
Outstanding Balance
$140,822
Interest Rate
4.39%
Mortgage Type
Purchase Money Mortgage
Estimated Equity
$373,593
Purchase Details
Closed on
Jun 9, 1995
Sold by
Ferry Paul W and Ferry Rhonda L
Bought by
Mendoza Scott J and Mendoza Stephaniel
Create a Home Valuation Report for This Property
The Home Valuation Report is an in-depth analysis detailing your home's value as well as a comparison with similar homes in the area
Home Values in the Area
Average Home Value in this Area
Purchase History
| Date | Buyer | Sale Price | Title Company |
|---|---|---|---|
| Sullivan Lisa A | $215,000 | -- | |
| Mendoza Scott J | $135,000 | -- |
Source: Public Records
Mortgage History
| Date | Status | Borrower | Loan Amount |
|---|---|---|---|
| Open | Sullivan Lisa A | $212,143 | |
| Previous Owner | Mendoza Scott J | $70,000 | |
| Previous Owner | Mendoza Scott J | $112,000 |
Source: Public Records
Tax History
| Year | Tax Paid | Tax Assessment Tax Assessment Total Assessment is a certain percentage of the fair market value that is determined by local assessors to be the total taxable value of land and additions on the property. | Land | Improvement |
|---|---|---|---|---|
| 2025 | $4,795 | $418,800 | $106,700 | $312,100 |
| 2024 | $4,400 | $382,900 | $102,800 | $280,100 |
| 2023 | $4,002 | $326,200 | $84,900 | $241,300 |
| 2022 | $3,724 | $295,100 | $80,900 | $214,200 |
| 2021 | $3,477 | $251,400 | $77,000 | $174,400 |
| 2020 | $3,141 | $217,400 | $75,800 | $141,600 |
| 2019 | $2,992 | $205,200 | $73,000 | $132,200 |
| 2018 | $2,877 | $196,800 | $79,100 | $117,700 |
| 2017 | $2,622 | $187,300 | $75,400 | $111,900 |
| 2016 | $2,584 | $189,600 | $80,200 | $109,400 |
| 2015 | $2,480 | $189,600 | $80,200 | $109,400 |
| 2014 | $2,463 | $195,800 | $77,800 | $118,000 |
Source: Public Records
Map
Nearby Homes
- 20 Wilcox St
- 245 Dwelly St
- 464 Birch St
- 609 King Philip St
- 1334 S Main St
- 1273-1279 S Main St
- 70 Brown St
- 1846 S Main St
- 1852 S Main St
- 234 Kilburn St
- 917 Dwelly St
- 57 Larouche St
- 15 Higgins St
- 344-354 E Main St
- 71 Mystic St Unit 3
- 219 Montaup St
- 700 Shore Dr Unit 6-604
- 700 Shore Dr Unit 1205
- 700 Shore Dr Unit 810
- 82 Montaup St
Your Personal Tour Guide
Ask me questions while you tour the home.