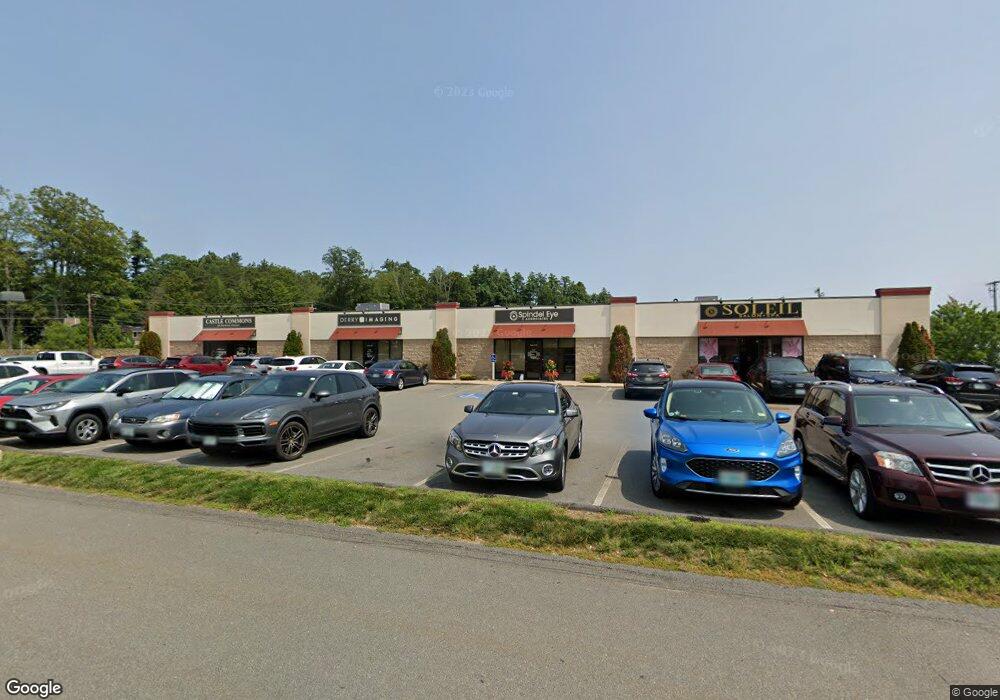
49 Range Rd Windham, NH 03087
Estimated Value: $3,000,593
Studio
8
Baths
23,964
Sq Ft
$125/Sq Ft
Est. Value
About This Home
This home is located at 49 Range Rd, Windham, NH 03087 and is currently estimated at $3,000,593, approximately $125 per square foot. 49 Range Rd is a home located in Rockingham County with nearby schools including Golden Brook Elementary School, Windham Middle School, and Windham High School.
Ownership History
Date
Name
Owned For
Owner Type
Purchase Details
Closed on
Dec 22, 2005
Sold by
Haynes Management Inc
Bought by
Mashop Dev Llc
Current Estimated Value
Purchase Details
Closed on
Aug 23, 1999
Sold by
Labrie Paul J and Labrie Patricia A
Bought by
Haynes Management Inc
Create a Home Valuation Report for This Property
The Home Valuation Report is an in-depth analysis detailing your home's value as well as a comparison with similar homes in the area
Home Values in the Area
Average Home Value in this Area
Purchase History
| Date | Buyer | Sale Price | Title Company |
|---|---|---|---|
| Mashop Dev Llc | $1,500,000 | -- | |
| Haynes Management Inc | $1,250,000 | -- |
Source: Public Records
Mortgage History
| Date | Status | Borrower | Loan Amount |
|---|---|---|---|
| Open | Haynes Management Inc | $400,000 | |
| Open | Haynes Management Inc | $1,200,000 | |
| Closed | Haynes Management Inc | $400,000 |
Source: Public Records
Tax History
| Year | Tax Paid | Tax Assessment Tax Assessment Total Assessment is a certain percentage of the fair market value that is determined by local assessors to be the total taxable value of land and additions on the property. | Land | Improvement |
|---|---|---|---|---|
| 2024 | $82,305 | $3,635,400 | $1,273,400 | $2,362,000 |
| 2023 | $77,798 | $3,635,400 | $1,273,400 | $2,362,000 |
| 2022 | $71,719 | $3,629,500 | $1,273,400 | $2,356,100 |
| 2021 | $68,155 | $3,660,300 | $1,273,400 | $2,386,900 |
| 2020 | $70,022 | $3,660,300 | $1,273,400 | $2,386,900 |
| 2019 | $72,095 | $3,197,100 | $990,700 | $2,206,400 |
| 2018 | $74,460 | $3,197,100 | $990,700 | $2,206,400 |
| 2017 | $64,581 | $3,197,100 | $990,700 | $2,206,400 |
| 2016 | $53,505 | $2,452,100 | $990,700 | $1,461,400 |
| 2015 | $47,899 | $2,205,300 | $990,700 | $1,214,600 |
| 2014 | $53,150 | $2,214,600 | $854,000 | $1,360,600 |
| 2013 | $52,265 | $2,214,600 | $854,000 | $1,360,600 |
Source: Public Records
Map
Nearby Homes
- 10 Harris Rd
- 144 N Policy St
- 5 Johnson St
- 6 Chadwick Cir
- 54 Enterprise Dr
- 27 London Rd
- 29 London Rd
- 108 S Shore Rd
- 45 Trails Edge Rd
- 24 Rockingham Rd
- 39 Overton Rd
- 53 Trails Edge Rd
- 55 Trails Edge Rd
- 3 Evergreen Way Unit End unit
- 7 Lilac Ridge Rd
- 11 Sullivan Ct
- 4 Arbor Rd
- 16 Arbor Rd
- 98 Trails Edge Rd
- 30 Main St
Your Personal Tour Guide
Ask me questions while you tour the home.