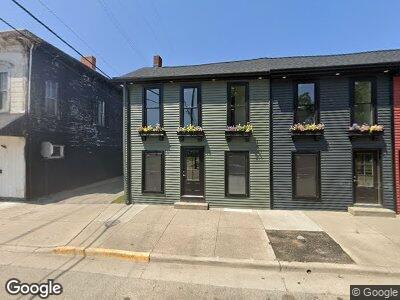
49 S Main St Camden, OH 45311
Estimated Value: $109,557 - $171,000
5
Beds
3
Baths
2,196
Sq Ft
$63/Sq Ft
Est. Value
About This Home
This home is located at 49 S Main St, Camden, OH 45311 and is currently estimated at $138,389, approximately $63 per square foot. 49 S Main St is a home located in Preble County with nearby schools including Preble Shawnee Elementary School, West Elkton Intermediate School, and Preble Shawnee Junior/Senior High School.
Ownership History
Date
Name
Owned For
Owner Type
Purchase Details
Closed on
Mar 17, 2023
Sold by
Given Not
Bought by
Green Wilma J
Current Estimated Value
Purchase Details
Closed on
Jun 10, 2014
Sold by
Green Bobby
Bought by
Green Bobby and Green Wilma J
Purchase Details
Closed on
Jan 13, 2010
Sold by
Secretary Of Housing & Urban Development
Bought by
Green Bobby
Purchase Details
Closed on
Nov 14, 2008
Sold by
Parsley Gregory
Bought by
Secretary Of Housing & Urban Development
Purchase Details
Closed on
Oct 22, 2007
Sold by
Parsley Gregory A and Parsley Karen M
Bought by
Ghost Pag Llc
Purchase Details
Closed on
Jan 5, 1996
Sold by
Hilbert Patricia G
Bought by
Parsley Gregory A
Home Financials for this Owner
Home Financials are based on the most recent Mortgage that was taken out on this home.
Original Mortgage
$43,850
Interest Rate
7.41%
Mortgage Type
FHA
Create a Home Valuation Report for This Property
The Home Valuation Report is an in-depth analysis detailing your home's value as well as a comparison with similar homes in the area
Home Values in the Area
Average Home Value in this Area
Purchase History
| Date | Buyer | Sale Price | Title Company |
|---|---|---|---|
| Green Bobby | -- | None Available | |
| Green Bobby | $3,800 | Lakeside Title & Escrow Agen | |
| Secretary Of Housing & Urban Development | $20,000 | None Available | |
| Ghost Pag Llc | -- | Attorney | |
| Parsley Gregory A | $35,000 | -- |
Source: Public Records
Mortgage History
| Date | Status | Borrower | Loan Amount |
|---|---|---|---|
| Previous Owner | Parsley Gregory A | $43,850 |
Source: Public Records
Tax History Compared to Growth
Tax History
| Year | Tax Paid | Tax Assessment Tax Assessment Total Assessment is a certain percentage of the fair market value that is determined by local assessors to be the total taxable value of land and additions on the property. | Land | Improvement |
|---|---|---|---|---|
| 2024 | $1,087 | $26,290 | $3,710 | $22,580 |
| 2023 | $1,087 | $26,290 | $3,710 | $22,580 |
| 2022 | $803 | $17,860 | $3,400 | $14,460 |
| 2021 | $886 | $17,860 | $3,400 | $14,460 |
| 2020 | $855 | $17,860 | $3,400 | $14,460 |
| 2019 | $793 | $15,760 | $2,910 | $12,850 |
| 2018 | $815 | $15,760 | $2,910 | $12,850 |
| 2017 | $815 | $15,760 | $2,910 | $12,850 |
| 2016 | $660 | $13,170 | $2,910 | $10,260 |
| 2014 | $342 | $13,170 | $2,910 | $10,260 |
| 2013 | $702 | $13,160 | $2,905 | $10,255 |
Source: Public Records
Map
Nearby Homes
- 388 W Hendricks St
- 390 W Hendricks St
- 0 County Highway 227
- 471 Camden West Elkton Rd
- 521 Camden West Elkton Rd
- 115 Katherine Ct
- 0 Sugar Valley Dr
- 1048 Somers Gratis Rd
- 0 Sugar Valley Dr
- 8425 Dillman Rd
- 11038 State Route 227
- 1246 Oxford Germantown Rd
- 0 Oslo Cove Unit 1792284
- 0 Oslo Cove Unit 10047692
- 0 Oslo Cove
- 826 Lars Cove
- 820 Lars Cove
- 299 Longman Rd
- 0 Lars Cove Unit 1745954
- 809 Lakengren Dr
- 49 S Main St
- 39 S Main St
- 31-35 S Main St
- 65 S Main St Unit 69
- 59 S Main St
- 21 S Shawnee Plains Ct
- 44 S Lafayette St
- 77 S Main St
- 52 S Lafayette St
- 19 S Main St
- 58 S Lafayette St
- 32 S Lafayette St
- 83 S Main St
- 26 S Main St
- 70 S Lafayette St
- 16 S Main St
- 91 S Main St
- 76 S Lafayette St
- 22 S Main St
- 24 S Main St