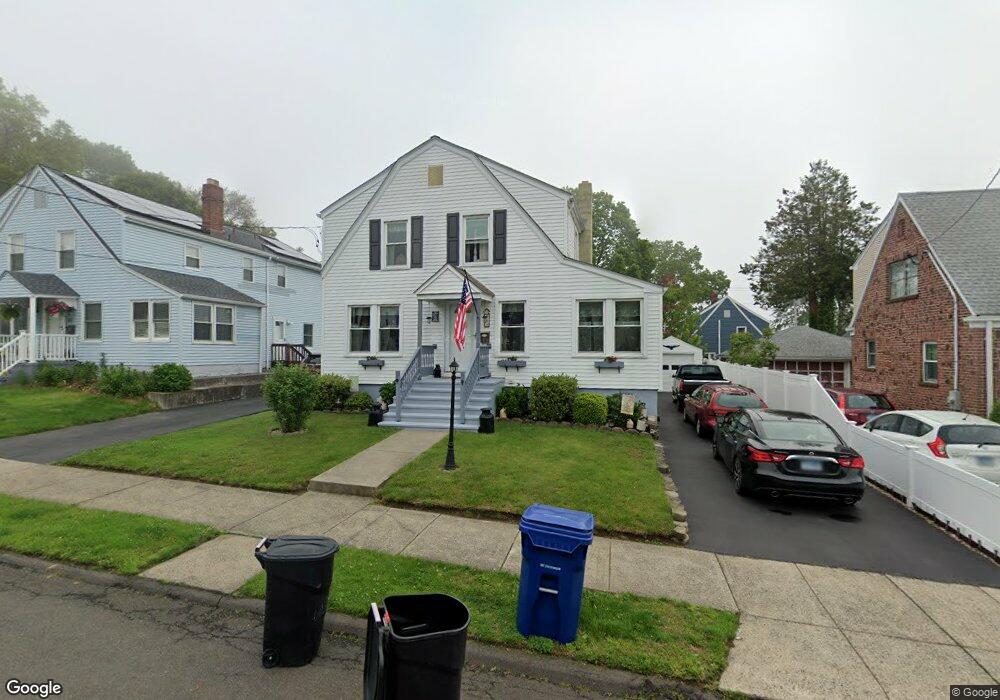
49 Sumac St West Haven, CT 06516
West Shore NeighborhoodEstimated Value: $392,629 - $416,000
3
Beds
2
Baths
1,303
Sq Ft
$309/Sq Ft
Est. Value
About This Home
This home is located at 49 Sumac St, West Haven, CT 06516 and is currently estimated at $402,157, approximately $308 per square foot. 49 Sumac St is a home located in New Haven County with nearby schools including Carrigan 5/6 Intermediate School, Harry M. Bailey Middle School, and West Haven High School.
Ownership History
Date
Name
Owned For
Owner Type
Purchase Details
Closed on
Jul 28, 2000
Sold by
Jo-Lynn Inc
Bought by
Rainey William B and Rainey Lorraine A
Current Estimated Value
Home Financials for this Owner
Home Financials are based on the most recent Mortgage that was taken out on this home.
Original Mortgage
$154,397
Interest Rate
8.18%
Mortgage Type
Purchase Money Mortgage
Purchase Details
Closed on
Mar 30, 2000
Sold by
Decerbo Katherine A
Bought by
Jo-Lynn Llc
Create a Home Valuation Report for This Property
The Home Valuation Report is an in-depth analysis detailing your home's value as well as a comparison with similar homes in the area
Home Values in the Area
Average Home Value in this Area
Purchase History
| Date | Buyer | Sale Price | Title Company |
|---|---|---|---|
| Rainey William B | $155,900 | -- | |
| Jo-Lynn Llc | $35,000 | -- | |
| Rainey William B | $155,900 | -- | |
| Jo-Lynn Llc | $35,000 | -- |
Source: Public Records
Mortgage History
| Date | Status | Borrower | Loan Amount |
|---|---|---|---|
| Closed | Jo-Lynn Llc | $156,000 | |
| Closed | Jo-Lynn Llc | $154,397 |
Source: Public Records
Tax History Compared to Growth
Tax History
| Year | Tax Paid | Tax Assessment Tax Assessment Total Assessment is a certain percentage of the fair market value that is determined by local assessors to be the total taxable value of land and additions on the property. | Land | Improvement |
|---|---|---|---|---|
| 2025 | $6,953 | $211,540 | $69,090 | $142,450 |
| 2024 | $6,223 | $132,790 | $47,880 | $84,910 |
| 2023 | $5,989 | $132,790 | $47,880 | $84,910 |
| 2022 | $5,881 | $132,790 | $47,880 | $84,910 |
| 2021 | $5,881 | $132,790 | $47,880 | $84,910 |
| 2020 | $5,771 | $118,720 | $43,610 | $75,110 |
| 2019 | $5,587 | $118,720 | $43,610 | $75,110 |
| 2018 | $5,507 | $118,720 | $43,610 | $75,110 |
| 2017 | $5,359 | $118,720 | $43,610 | $75,110 |
| 2016 | $5,300 | $118,720 | $43,610 | $75,110 |
| 2015 | $5,254 | $131,740 | $48,650 | $83,090 |
| 2014 | $5,254 | $131,740 | $48,650 | $83,090 |
Source: Public Records
Map
Nearby Homes