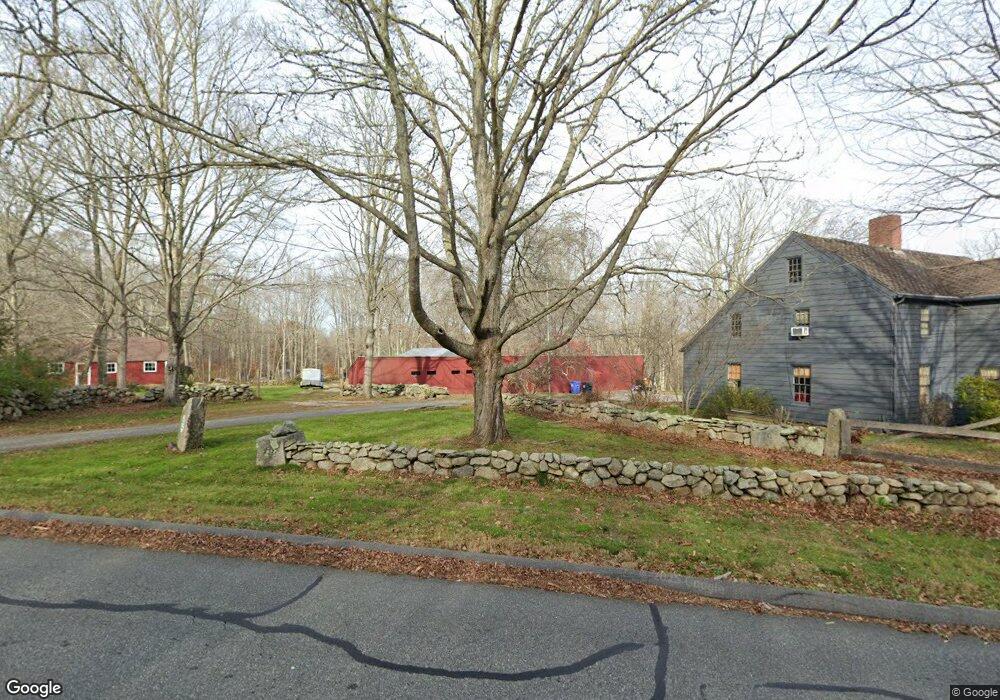
49 Town Farm Rd Ledyard, CT 06339
Estimated Value: $462,000 - $719,000
4
Beds
3
Baths
3,124
Sq Ft
$191/Sq Ft
Est. Value
About This Home
This home is located at 49 Town Farm Rd, Ledyard, CT 06339 and is currently estimated at $598,173, approximately $191 per square foot. 49 Town Farm Rd is a home located in New London County with nearby schools including Ledyard Middle School and Ledyard High School.
Ownership History
Date
Name
Owned For
Owner Type
Purchase Details
Closed on
Jul 31, 2025
Sold by
Levine David C and Levine Keli D
Bought by
Williams Amanda G and Williams Dylan P
Current Estimated Value
Purchase Details
Closed on
Jul 10, 2008
Sold by
Lissauer Ivan M and Lissauer Ellen B
Bought by
Beaulieu David P and Vitko Michelle A
Home Financials for this Owner
Home Financials are based on the most recent Mortgage that was taken out on this home.
Original Mortgage
$371,200
Interest Rate
6.13%
Mortgage Type
Purchase Money Mortgage
Purchase Details
Closed on
Sep 29, 2006
Sold by
Pratviel Nancy D and Pratviel Mary Alice
Bought by
Bean John R and Jones Stephanie
Purchase Details
Closed on
Oct 23, 1998
Sold by
Robert O Brown Rt and Brown
Bought by
Levine David C and Levine Keli D
Purchase Details
Closed on
Apr 3, 1997
Sold by
Wininger Robert
Bought by
Pratviel Nancy D and Pratviel Maryalice
Create a Home Valuation Report for This Property
The Home Valuation Report is an in-depth analysis detailing your home's value as well as a comparison with similar homes in the area
Home Values in the Area
Average Home Value in this Area
Purchase History
| Date | Buyer | Sale Price | Title Company |
|---|---|---|---|
| Williams Amanda G | -- | -- | |
| Beaulieu David P | $464,000 | -- | |
| Beaulieu David P | $464,000 | -- | |
| Bean John R | $148,000 | -- | |
| Bean John R | $148,000 | -- | |
| Levine David C | $102,500 | -- | |
| Pratviel Nancy D | $76,500 | -- | |
| Pratviel Nancy D | $76,500 | -- |
Source: Public Records
Mortgage History
| Date | Status | Borrower | Loan Amount |
|---|---|---|---|
| Previous Owner | Pratviel Nancy D | $200,000 | |
| Previous Owner | Pratviel Nancy D | $371,200 |
Source: Public Records
Tax History Compared to Growth
Tax History
| Year | Tax Paid | Tax Assessment Tax Assessment Total Assessment is a certain percentage of the fair market value that is determined by local assessors to be the total taxable value of land and additions on the property. | Land | Improvement |
|---|---|---|---|---|
| 2025 | $10,537 | $283,710 | $102,620 | $181,090 |
| 2024 | $9,989 | $283,710 | $102,620 | $181,090 |
| 2023 | $9,805 | $283,710 | $102,620 | $181,090 |
| 2022 | $9,595 | $283,710 | $102,620 | $181,090 |
| 2021 | $9,533 | $283,710 | $102,620 | $181,090 |
| 2020 | $10,049 | $287,350 | $97,510 | $189,840 |
| 2019 | $10,074 | $287,350 | $97,510 | $189,840 |
| 2018 | $9,853 | $287,350 | $97,510 | $189,840 |
| 2017 | $9,350 | $287,350 | $97,510 | $189,840 |
| 2016 | $9,166 | $287,350 | $97,510 | $189,840 |
| 2015 | $8,735 | $287,350 | $97,510 | $189,840 |
| 2014 | $9,073 | $303,450 | $102,620 | $200,830 |
Source: Public Records
Map
Nearby Homes
- 61 Town Farm Rd
- 12 Cartridge Trail
- 113 Meeting House Ln
- 22 Cliff Rd
- 115 Meeting House Ln
- 22 Boulder Way
- 7 Captain Amos Stanton Dr
- 148 Gallup Hill Rd
- 6 Lakeside Dr Unit P
- 4 Lakeside Dr Unit L
- 20 Lakeside Dr Unit P
- 120 Gallup Hill Rd Unit 2A
- 120 Gallup Hill Rd Unit 3C
- 5 Sachem Ln
- 45R Long Pond Rd S
- 332 Lantern Hill Rd
- 188 Wolf Neck Rd
- 155 Iron St
- Lot 5 Lantern Hill Rd
- 7 Chidley Way
- 48A Town Farm Rd
- 46 Town Farm Rd
- 43 Town Farm Rd
- 57 Town Farm Rd
- 40 Highland Dr
- 42 Highland Dr
- 48 Town Farm Rd
- 38 Highland Dr
- 58 Town Farm Rd
- 44 Highland Dr
- 67 Town Farm Rd
- 36 Highland Dr
- 46 Highland Dr
- 39 Highland Dr
- 34 Highland Dr
- 48 Highland Dr
- 45 Highland Dr
- 37 Highland Dr
- 20 Cartridge Trail
- 32 Highland Dr