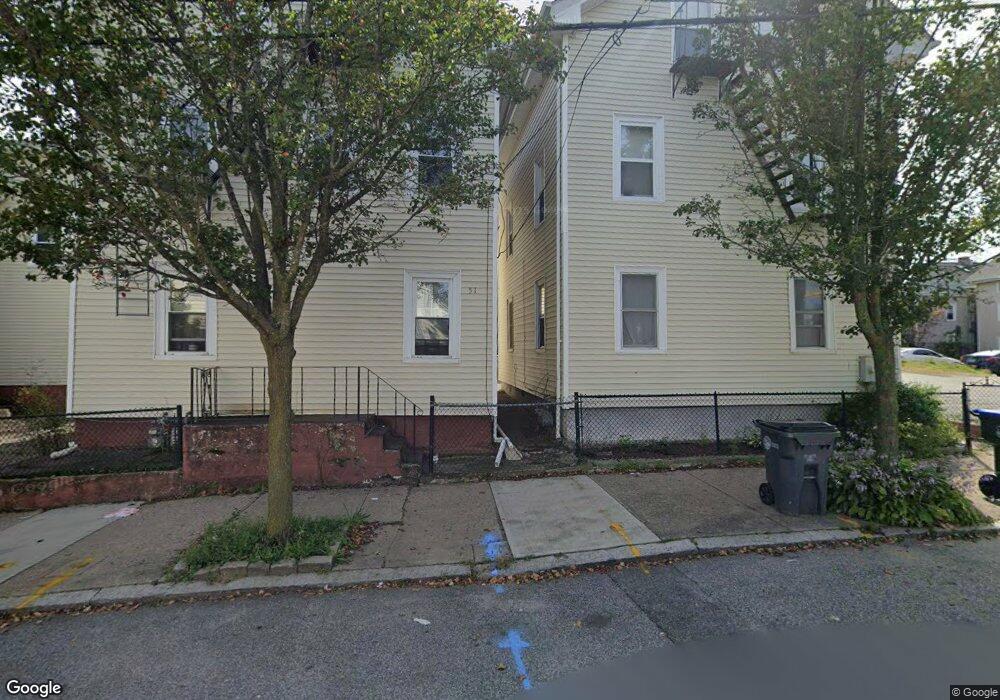
49 Trenton St Unit 2 Providence, RI 02906
Fox Point NeighborhoodEstimated Value: $597,963 - $957,000
4
Beds
1
Bath
1,400
Sq Ft
$518/Sq Ft
Est. Value
About This Home
This home is located at 49 Trenton St Unit 2, Providence, RI 02906 and is currently estimated at $724,654, approximately $517 per square foot. 49 Trenton St Unit 2 is a home located in Providence County with nearby schools including Asa Messer Elementary School, Charles N. Fortes Elementary School, and Robert L. Bailey IV Elementary.
Ownership History
Date
Name
Owned For
Owner Type
Purchase Details
Closed on
Jan 20, 2017
Sold by
Kbbx2 Llc
Bought by
Saporita John R
Current Estimated Value
Purchase Details
Closed on
Jan 6, 2015
Sold by
Providence Comnty Acti
Bought by
Royalty Realty Llc
Home Financials for this Owner
Home Financials are based on the most recent Mortgage that was taken out on this home.
Original Mortgage
$235,000
Interest Rate
3.99%
Mortgage Type
New Conventional
Create a Home Valuation Report for This Property
The Home Valuation Report is an in-depth analysis detailing your home's value as well as a comparison with similar homes in the area
Home Values in the Area
Average Home Value in this Area
Purchase History
| Date | Buyer | Sale Price | Title Company |
|---|---|---|---|
| Saporita John R | $430,000 | -- | |
| Royalty Realty Llc | $150,000 | -- |
Source: Public Records
Mortgage History
| Date | Status | Borrower | Loan Amount |
|---|---|---|---|
| Previous Owner | Royalty Realty Llc | $235,000 |
Source: Public Records
Tax History Compared to Growth
Tax History
| Year | Tax Paid | Tax Assessment Tax Assessment Total Assessment is a certain percentage of the fair market value that is determined by local assessors to be the total taxable value of land and additions on the property. | Land | Improvement |
|---|---|---|---|---|
| 2025 | $7,820 | $558,600 | $314,000 | $244,600 |
| 2024 | $7,386 | $402,500 | $219,800 | $182,700 |
| 2023 | $7,386 | $402,500 | $219,800 | $182,700 |
| 2022 | $7,165 | $402,500 | $219,800 | $182,700 |
| 2021 | $6,835 | $278,300 | $167,300 | $111,000 |
| 2020 | $6,835 | $278,300 | $167,300 | $111,000 |
| 2019 | $6,835 | $278,300 | $167,300 | $111,000 |
| 2018 | $6,977 | $218,300 | $145,600 | $72,700 |
| 2017 | $6,977 | $218,300 | $145,600 | $72,700 |
| 2016 | $6,977 | $218,300 | $145,600 | $72,700 |
| 2015 | -- | $221,300 | $145,600 | $75,700 |
| 2014 | -- | $221,300 | $145,600 | $75,700 |
| 2013 | -- | $221,300 | $145,600 | $75,700 |
Source: Public Records
Map
Nearby Homes
- 73 Trenton St
- 670 Wickenden St
- 96 Gano St Unit 3
- 130 Gano St
- 130 Gano St Unit A
- 427 Wickenden St
- 207 Williams St Unit 2
- 323 Wickenden St
- 104 Sheldon St
- 117 Benevolent St
- 273 Wickenden St
- 20 E George St
- 63 Pitman St Unit 5
- 63 Pitman St Unit 4
- 124 Pitman St
- 165 Waterman St Unit 2
- 84 Transit St
- 55 Second St
- 81 Burgess Ave
- 58 Summit St