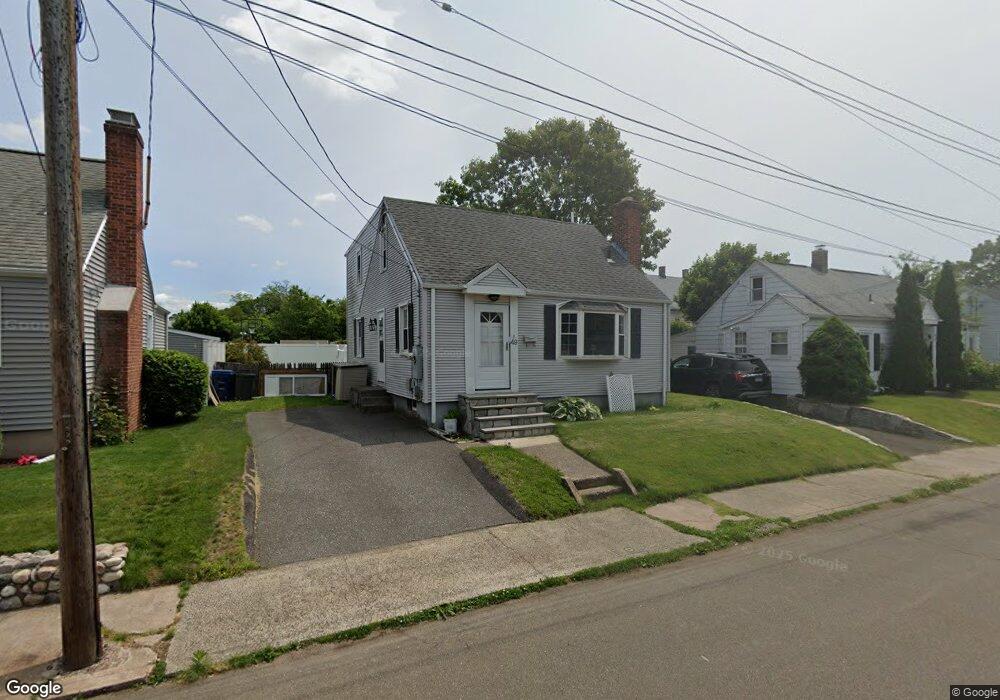
49 Union Ave West Haven, CT 06516
West Haven Center NeighborhoodEstimated Value: $277,000 - $327,000
2
Beds
1
Bath
1,267
Sq Ft
$245/Sq Ft
Est. Value
About This Home
This home is located at 49 Union Ave, West Haven, CT 06516 and is currently estimated at $309,859, approximately $244 per square foot. 49 Union Ave is a home located in New Haven County with nearby schools including Carrigan 5/6 Intermediate School, Harry M. Bailey Middle School, and West Haven High School.
Ownership History
Date
Name
Owned For
Owner Type
Purchase Details
Closed on
Dec 10, 2009
Sold by
Hsbc Mortgage Svcs Inc
Bought by
Glynn Meghan Eileen
Current Estimated Value
Purchase Details
Closed on
Apr 24, 2009
Sold by
Annueci Steven
Bought by
Hsbc Mortgage Svcs Inc
Purchase Details
Closed on
Apr 3, 2003
Sold by
Petrucelli Tammy M
Bought by
Annucci Steven
Purchase Details
Closed on
Sep 25, 1998
Sold by
Sharpe Margaret A
Bought by
Petrucelli Tamy M
Purchase Details
Closed on
Jun 29, 1995
Sold by
Tracy Gladys M
Bought by
Petrucelli Tammy M and Sharpe Margaret A
Create a Home Valuation Report for This Property
The Home Valuation Report is an in-depth analysis detailing your home's value as well as a comparison with similar homes in the area
Home Values in the Area
Average Home Value in this Area
Purchase History
| Date | Buyer | Sale Price | Title Company |
|---|---|---|---|
| Glynn Meghan Eileen | $125,770 | -- | |
| Hsbc Mortgage Svcs Inc | -- | -- | |
| Annucci Steven | $139,000 | -- | |
| Petrucelli Tamy M | $37,500 | -- | |
| Petrucelli Tammy M | $75,000 | -- | |
| Glynn Meghan Eileen | $125,770 | -- | |
| Hsbc Mortgage Svcs Inc | -- | -- | |
| Annucci Steven | $139,000 | -- | |
| Petrucelli Tamy M | $37,500 | -- | |
| Petrucelli Tammy M | $75,000 | -- |
Source: Public Records
Mortgage History
| Date | Status | Borrower | Loan Amount |
|---|---|---|---|
| Open | Petrucelli Tammy M | $129,020 | |
| Closed | Petrucelli Tammy M | $138,739 |
Source: Public Records
Tax History Compared to Growth
Tax History
| Year | Tax Paid | Tax Assessment Tax Assessment Total Assessment is a certain percentage of the fair market value that is determined by local assessors to be the total taxable value of land and additions on the property. | Land | Improvement |
|---|---|---|---|---|
| 2025 | $6,773 | $196,140 | $57,540 | $138,600 |
| 2024 | $6,083 | $125,370 | $39,830 | $85,540 |
| 2023 | $5,831 | $125,370 | $39,830 | $85,540 |
| 2022 | $5,717 | $125,370 | $39,830 | $85,540 |
| 2021 | $5,717 | $125,370 | $39,830 | $85,540 |
| 2020 | $5,554 | $110,040 | $31,990 | $78,050 |
| 2019 | $5,356 | $110,040 | $31,990 | $78,050 |
| 2018 | $5,309 | $110,040 | $31,990 | $78,050 |
| 2017 | $5,024 | $110,040 | $31,990 | $78,050 |
| 2016 | $5,013 | $110,040 | $31,990 | $78,050 |
| 2015 | $4,915 | $121,800 | $35,770 | $86,030 |
| 2014 | $4,884 | $121,800 | $35,770 | $86,030 |
Source: Public Records
Map
Nearby Homes