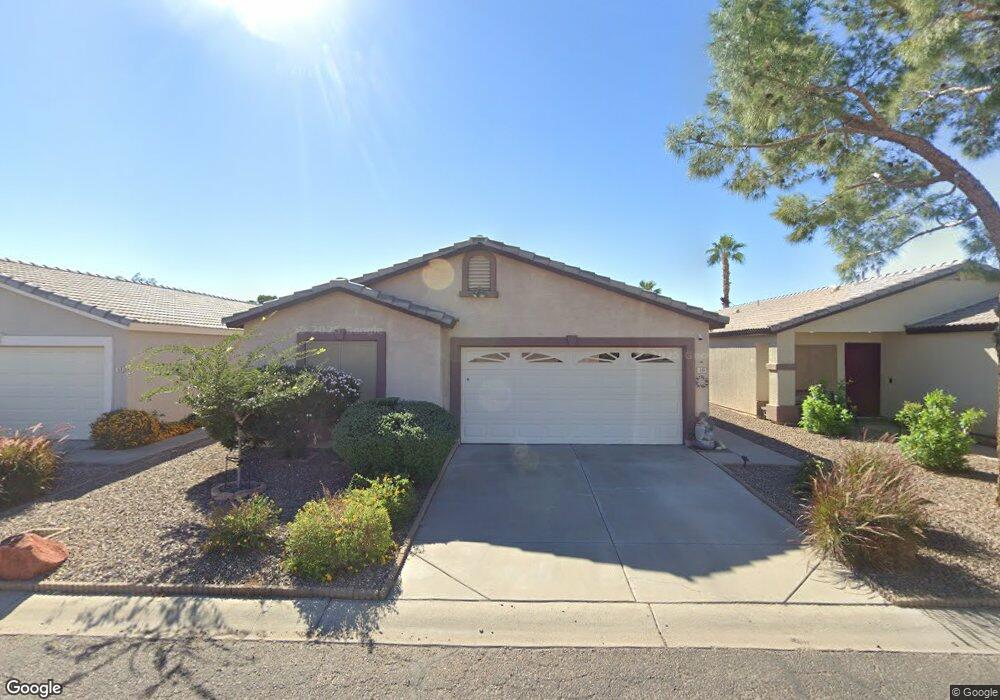
49 W Ingram St Mesa, AZ 85201
Whitman Park NeighborhoodEstimated Value: $351,965 - $444,000
Studio
2
Baths
1,427
Sq Ft
$286/Sq Ft
Est. Value
About This Home
This home is located at 49 W Ingram St, Mesa, AZ 85201 and is currently estimated at $407,491, approximately $285 per square foot. 49 W Ingram St is a home located in Maricopa County with nearby schools including Whitman Elementary School, Franklin at Brimhall Elementary School, and Franklin West Elementary School.
Ownership History
Date
Name
Owned For
Owner Type
Purchase Details
Closed on
Jun 10, 2024
Sold by
Stevens Mark S and Stevens Judith A
Bought by
Mark S And Judith A Stevens Living Trust and Stevens
Current Estimated Value
Home Financials for this Owner
Home Financials are based on the most recent Mortgage that was taken out on this home.
Original Mortgage
$281,847
Outstanding Balance
$277,409
Interest Rate
7.22%
Mortgage Type
FHA
Estimated Equity
$130,082
Purchase Details
Closed on
Sep 22, 2022
Sold by
Stevens Mark S and Stevens Ann Judith
Bought by
Mark S And Judith A Stevens Living Trust
Purchase Details
Closed on
May 5, 2014
Sold by
Stevens Mark S
Bought by
Stevens Mark S and Stevens Judith Ann
Purchase Details
Closed on
Jan 12, 2003
Sold by
Stevens Mae R
Bought by
Stevens Mark S
Purchase Details
Closed on
Apr 17, 1999
Sold by
Great Western Communities Inc
Bought by
G W Building Co
Create a Home Valuation Report for This Property
The Home Valuation Report is an in-depth analysis detailing your home's value as well as a comparison with similar homes in the area
Home Values in the Area
Average Home Value in this Area
Purchase History
| Date | Buyer | Sale Price | Title Company |
|---|---|---|---|
| Mark S And Judith A Stevens Living Trust | -- | None Listed On Document | |
| Stevens Mark | -- | None Listed On Document | |
| Mark S And Judith A Stevens Living Trust | -- | -- | |
| Stevens Mark S | -- | None Available | |
| Stevens Mark S | -- | -- | |
| G W Building Co | -- | Security Title Agency |
Source: Public Records
Mortgage History
| Date | Status | Borrower | Loan Amount |
|---|---|---|---|
| Open | Stevens Mark | $281,847 |
Source: Public Records
Tax History
| Year | Tax Paid | Tax Assessment Tax Assessment Total Assessment is a certain percentage of the fair market value that is determined by local assessors to be the total taxable value of land and additions on the property. | Land | Improvement |
|---|---|---|---|---|
| 2025 | $1,127 | $13,565 | -- | -- |
| 2024 | $1,139 | $12,919 | -- | -- |
| 2023 | $1,139 | $27,830 | $5,560 | $22,270 |
| 2022 | $1,114 | $21,260 | $4,250 | $17,010 |
| 2021 | $1,144 | $19,500 | $3,900 | $15,600 |
| 2020 | $1,129 | $17,780 | $3,550 | $14,230 |
| 2019 | $1,046 | $16,010 | $3,200 | $12,810 |
| 2018 | $999 | $14,950 | $2,990 | $11,960 |
| 2017 | $967 | $12,210 | $2,440 | $9,770 |
| 2016 | $950 | $11,510 | $2,300 | $9,210 |
| 2015 | $897 | $12,080 | $2,410 | $9,670 |
Source: Public Records
Map
Nearby Homes
- 143 W Ivyglen St
- 222 W Ivyglen St
- 139 W Hillside St
- 1505 N Center St Unit 218
- 102 E Jasmine St
- 150 E Jasmine St
- 1704 N Country Club Dr
- 250 E Hillside St
- 1636 N Wilbur
- 434 W Ivyglen St Unit 105
- 2060 N Center St Unit 251
- 2060 N Center St Unit 372
- 2060 N Center St Unit 183
- 2060 N Center St Unit 238
- 2060 N Center St Unit 133
- 2060 N Center St Unit 250
- 258 E Juniper St
- 2121 N Center St Unit 166
- 2121 N Center St Unit 184
- 2121 N Center St Unit 164
- 45 W Ingram St
- 55 W Ingram St
- 41 W Ingram St
- 59 W Ingram St
- 50 W Ivyglen St
- 56 W Ivyglen St
- 46 W Ivyglen St
- 37 W Ingram St
- 63 W Ingram St
- 62 W Ivyglen St
- 46 W Ingram St
- 40 W Ivyglen St
- 33 W Ingram St
- 103 W Ingram St
- 44 W Ingram St
- 102 W Ivyglen St
- 64 W Ingram St
- 34 W Ivyglen St
- 107 W Ingram St
- 29 W Ingram St
Your Personal Tour Guide
Ask me questions while you tour the home.