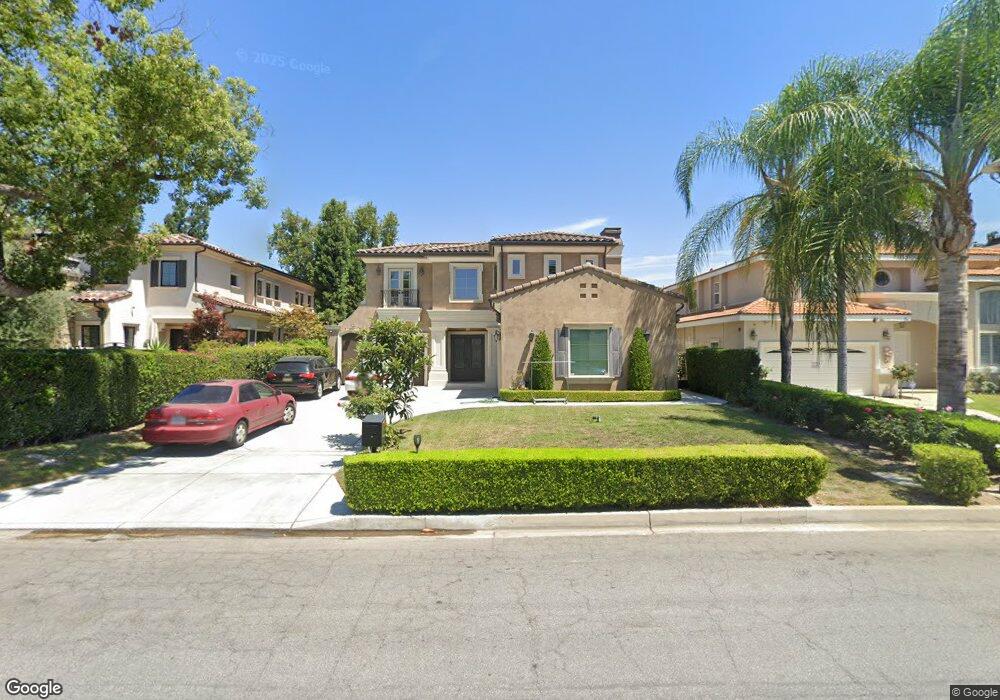
49 W Naomi Ave Arcadia, CA 91007
Estimated Value: $2,518,000 - $3,041,000
5
Beds
5
Baths
3,541
Sq Ft
$776/Sq Ft
Est. Value
About This Home
This home is located at 49 W Naomi Ave, Arcadia, CA 91007 and is currently estimated at $2,749,356, approximately $776 per square foot. 49 W Naomi Ave is a home located in Los Angeles County with nearby schools including Baldwin Stocker Elementary School, First Avenue Middle School, and Arcadia High School.
Ownership History
Date
Name
Owned For
Owner Type
Purchase Details
Closed on
Oct 19, 2018
Sold by
Chen Yingluan and Xiao Jiangsheng
Bought by
Xiao Jiangsheng and Chen Yingluan
Current Estimated Value
Purchase Details
Closed on
Sep 7, 2011
Sold by
Shaw John W
Bought by
Chen Yingluan and Xiao Jiangsheng
Home Financials for this Owner
Home Financials are based on the most recent Mortgage that was taken out on this home.
Original Mortgage
$1,139,600
Outstanding Balance
$746,451
Interest Rate
3.37%
Mortgage Type
Adjustable Rate Mortgage/ARM
Estimated Equity
$2,002,905
Purchase Details
Closed on
Jun 7, 2010
Sold by
Casey James P and Casey James P
Bought by
Shaw John W
Purchase Details
Closed on
Jun 3, 2010
Sold by
Ho Grace I
Bought by
Shaw John W
Purchase Details
Closed on
Aug 26, 2004
Sold by
Casey James P
Bought by
Casey James P and The James P Casey Iii Living Trust
Purchase Details
Closed on
Dec 18, 2000
Sold by
Casey James P and Charles W Fausone Exemption Tr
Bought by
Casey James P
Create a Home Valuation Report for This Property
The Home Valuation Report is an in-depth analysis detailing your home's value as well as a comparison with similar homes in the area
Home Values in the Area
Average Home Value in this Area
Purchase History
| Date | Buyer | Sale Price | Title Company |
|---|---|---|---|
| Xiao Jiangsheng | -- | None Available | |
| Chen Yingluan | $1,628,000 | Usa National Title Company | |
| Shaw John W | $720,000 | Chicago Title Company | |
| Shaw John W | -- | Chicago Title Company | |
| Casey James P | -- | -- | |
| Casey James P | -- | -- |
Source: Public Records
Mortgage History
| Date | Status | Borrower | Loan Amount |
|---|---|---|---|
| Open | Chen Yingluan | $1,139,600 |
Source: Public Records
Tax History Compared to Growth
Tax History
| Year | Tax Paid | Tax Assessment Tax Assessment Total Assessment is a certain percentage of the fair market value that is determined by local assessors to be the total taxable value of land and additions on the property. | Land | Improvement |
|---|---|---|---|---|
| 2025 | $22,604 | $2,044,850 | $1,431,902 | $612,948 |
| 2024 | $22,604 | $2,004,756 | $1,403,826 | $600,930 |
| 2023 | $22,130 | $1,965,448 | $1,376,300 | $589,148 |
| 2022 | $21,394 | $1,926,911 | $1,349,314 | $577,597 |
| 2021 | $21,002 | $1,889,129 | $1,322,857 | $566,272 |
| 2019 | $20,488 | $1,833,098 | $1,283,621 | $549,477 |
| 2018 | $19,995 | $1,797,155 | $1,258,452 | $538,703 |
| 2016 | $19,580 | $1,727,372 | $1,209,586 | $517,786 |
| 2015 | $19,238 | $1,701,426 | $1,191,417 | $510,009 |
| 2014 | $18,957 | $1,668,098 | $1,168,079 | $500,019 |
Source: Public Records
Map
Nearby Homes
- 1317 S Santa Anita Ave
- 77 W Naomi Ave
- 1122 S Santa Anita Ave
- 1036 Louise Ave
- 27 Christina St
- 194 W Pamela Rd
- 42 W Winnie Way
- 214 W Le Roy Ave
- 1780 S Santa Anita Ave
- 1327 S 2nd Ave
- 1025 S 2nd Ave
- 239 W Norman Ave
- 1010 Park Ave
- 45 Genoa St Unit A
- 1801 Lee Ave
- 25 Fano St
- 202 W Lemon Ave
- 1825 Lee Ave
- 4312 Jasmine Ln
- 182 W Wistaria Ave
- 53 W Naomi Ave
- 43 W Naomi Ave
- 39 W Naomi Ave
- 59 W Naomi Ave
- 48 W Le Roy Ave
- 42 W Le Roy Ave
- 52 W Le Roy Ave
- 38 W Le Roy Ave
- 58 W Le Roy Ave
- 35 W Naomi Ave
- 48 W Naomi Ave
- 46 W Naomi Ave
- 52 W Naomi Ave
- 34 W Le Roy Ave
- 36 W Le Roy Ave
- 62 W Le Roy Ave
- 38 W Naomi Ave
- 58 W Naomi Ave
- 29 W Naomi Ave
- 69 W Naomi Ave