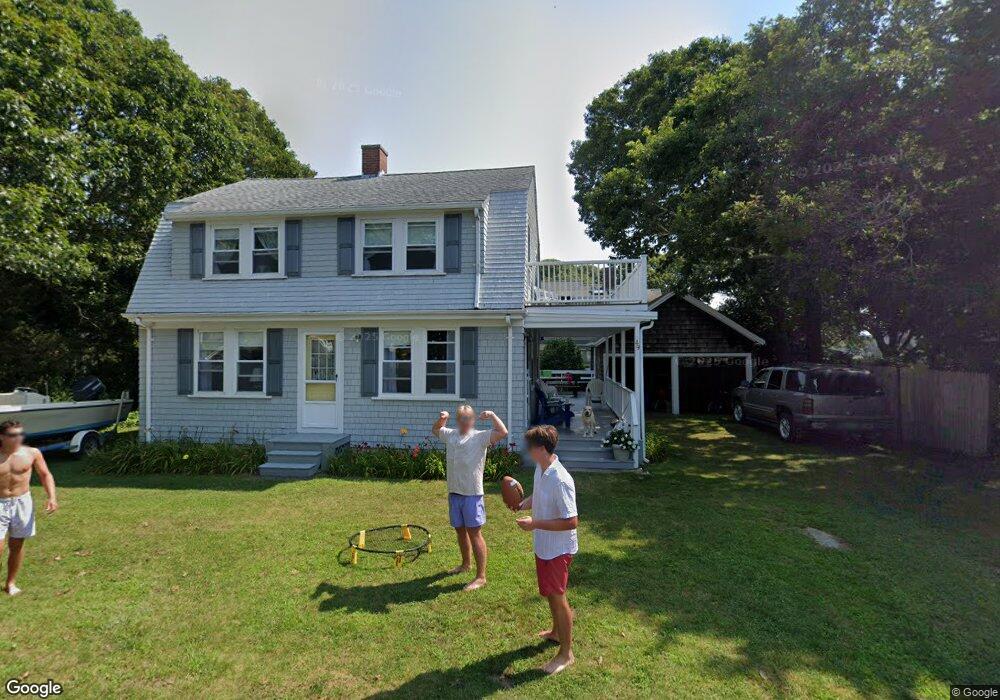
49 West Ave Marion, MA 02738
Estimated Value: $667,000 - $1,396,000
4
Beds
2
Baths
1,383
Sq Ft
$752/Sq Ft
Est. Value
About This Home
This home is located at 49 West Ave, Marion, MA 02738 and is currently estimated at $1,040,018, approximately $752 per square foot. 49 West Ave is a home located in Plymouth County with nearby schools including Old Rochester Regional High School.
Ownership History
Date
Name
Owned For
Owner Type
Purchase Details
Closed on
Sep 16, 2025
Sold by
Hoogeboom Sheila
Bought by
Sheila Googeboom Irt and Batchelder
Current Estimated Value
Purchase Details
Closed on
Dec 3, 2020
Sold by
Orurke Kevin and Hoogeboom Sheila
Bought by
Kevin A Orourke Ret and Orourke
Purchase Details
Closed on
Mar 4, 2011
Sold by
Orourke Mary T and Orourke Kevin
Bought by
Orourke Kevin and Orourke Gerard A
Purchase Details
Closed on
Dec 31, 1976
Bought by
Hoogeboom S and Hoogeboom Orourke K
Create a Home Valuation Report for This Property
The Home Valuation Report is an in-depth analysis detailing your home's value as well as a comparison with similar homes in the area
Home Values in the Area
Average Home Value in this Area
Purchase History
| Date | Buyer | Sale Price | Title Company |
|---|---|---|---|
| Sheila Googeboom Irt | -- | -- | |
| Kevin A Orourke Ret | -- | None Available | |
| Orourke Kevin | -- | -- | |
| Orourke Kevin | -- | -- | |
| Hoogeboom S | -- | -- |
Source: Public Records
Tax History Compared to Growth
Tax History
| Year | Tax Paid | Tax Assessment Tax Assessment Total Assessment is a certain percentage of the fair market value that is determined by local assessors to be the total taxable value of land and additions on the property. | Land | Improvement |
|---|---|---|---|---|
| 2025 | $9,033 | $969,179 | $716,779 | $252,400 |
| 2024 | $8,363 | $903,150 | $654,450 | $248,700 |
| 2023 | $7,911 | $838,004 | $607,704 | $230,300 |
| 2022 | $8,467 | $780,369 | $587,169 | $193,200 |
| 2021 | $7,890 | $696,999 | $518,599 | $178,400 |
| 2020 | $6,695 | $572,200 | $414,000 | $158,200 |
| 2019 | $5,903 | $535,200 | $377,000 | $158,200 |
| 2018 | $6,394 | $558,400 | $418,200 | $140,200 |
| 2017 | $6,290 | $551,300 | $418,200 | $133,100 |
| 2016 | $6,276 | $554,900 | $418,200 | $136,700 |
| 2015 | $6,021 | $541,900 | $412,300 | $129,600 |
Source: Public Records
Map
Nearby Homes