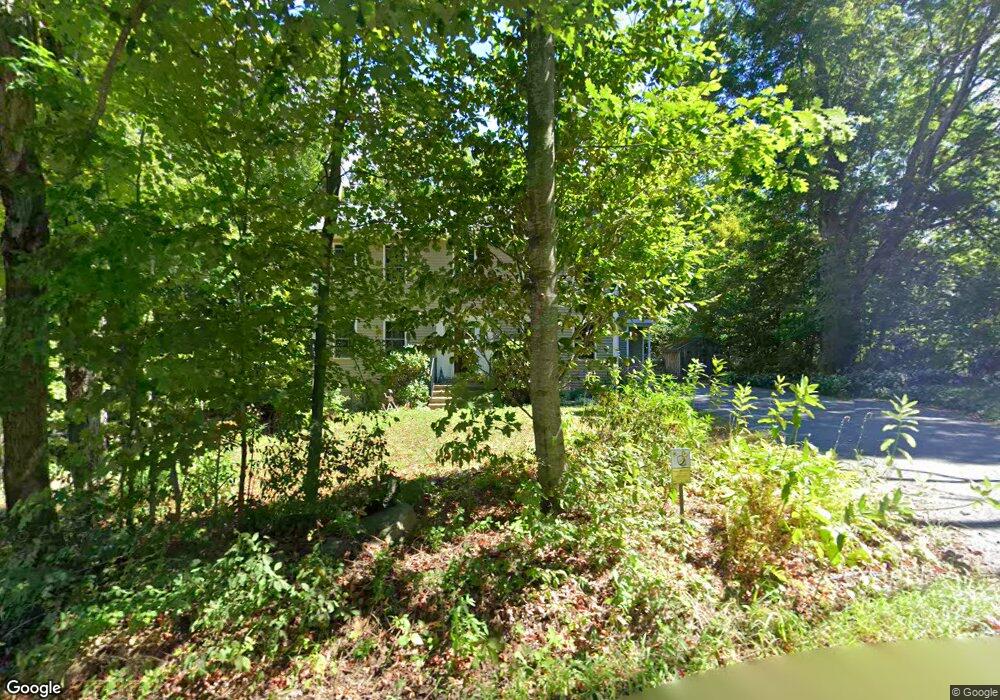
49 Willard Rd Ashburnham, MA 01430
Estimated Value: $468,748 - $554,000
3
Beds
3
Baths
1,956
Sq Ft
$268/Sq Ft
Est. Value
About This Home
This home is located at 49 Willard Rd, Ashburnham, MA 01430 and is currently estimated at $524,687, approximately $268 per square foot. 49 Willard Rd is a home located in Worcester County with nearby schools including Oakmont Regional High School and Cushing Academy.
Ownership History
Date
Name
Owned For
Owner Type
Purchase Details
Closed on
Sep 30, 2004
Sold by
Salo David R
Bought by
Picone Christopher M and Picone Meghan C
Current Estimated Value
Home Financials for this Owner
Home Financials are based on the most recent Mortgage that was taken out on this home.
Original Mortgage
$200,000
Outstanding Balance
$97,924
Interest Rate
5.81%
Mortgage Type
Purchase Money Mortgage
Estimated Equity
$426,763
Create a Home Valuation Report for This Property
The Home Valuation Report is an in-depth analysis detailing your home's value as well as a comparison with similar homes in the area
Home Values in the Area
Average Home Value in this Area
Purchase History
| Date | Buyer | Sale Price | Title Company |
|---|---|---|---|
| Picone Christopher M | $277,450 | -- | |
| Picone Christopher M | $277,450 | -- |
Source: Public Records
Mortgage History
| Date | Status | Borrower | Loan Amount |
|---|---|---|---|
| Open | Picone Christopher M | $18,000 | |
| Open | Picone Christopher M | $200,000 | |
| Closed | Picone Christopher M | $200,000 |
Source: Public Records
Tax History
| Year | Tax Paid | Tax Assessment Tax Assessment Total Assessment is a certain percentage of the fair market value that is determined by local assessors to be the total taxable value of land and additions on the property. | Land | Improvement |
|---|---|---|---|---|
| 2025 | $6,317 | $424,800 | $51,000 | $373,800 |
| 2024 | $6,083 | $386,200 | $50,800 | $335,400 |
| 2023 | $5,849 | $353,400 | $50,800 | $302,600 |
| 2022 | $6,138 | $325,100 | $47,000 | $278,100 |
| 2021 | $6,077 | $295,700 | $47,000 | $248,700 |
| 2020 | $5,944 | $295,700 | $47,000 | $248,700 |
| 2019 | $5,854 | $259,600 | $47,000 | $212,600 |
| 2018 | $5,777 | $246,900 | $44,500 | $202,400 |
| 2017 | $4,285 | $236,100 | $41,500 | $194,600 |
| 2016 | $5,358 | $235,500 | $40,900 | $194,600 |
| 2015 | $5,247 | $235,500 | $40,900 | $194,600 |
Source: Public Records
Map
Nearby Homes
- 75 Willard Rd
- 9 Willard Rd
- 14 Central St
- 10 Central St
- 36 Hillandale Rd
- 100 Main St
- 18 Corey Hill Rd
- 57 Ashby Rd
- 77 Barrel Rd
- 5 Russell Ave
- 149 Bragg Hill Rd
- 15 Kirali Ct
- 152 Ashby Rd
- 210 Bean Porridge Hill Rd
- Lot 6 Suffolk Ln
- Lot 5 Suffolk Ln
- Lot 3 W State Rd
- 6 Wyman Rd
- 170 N Common Rd
- 0 Rindge Turnpike
Your Personal Tour Guide
Ask me questions while you tour the home.