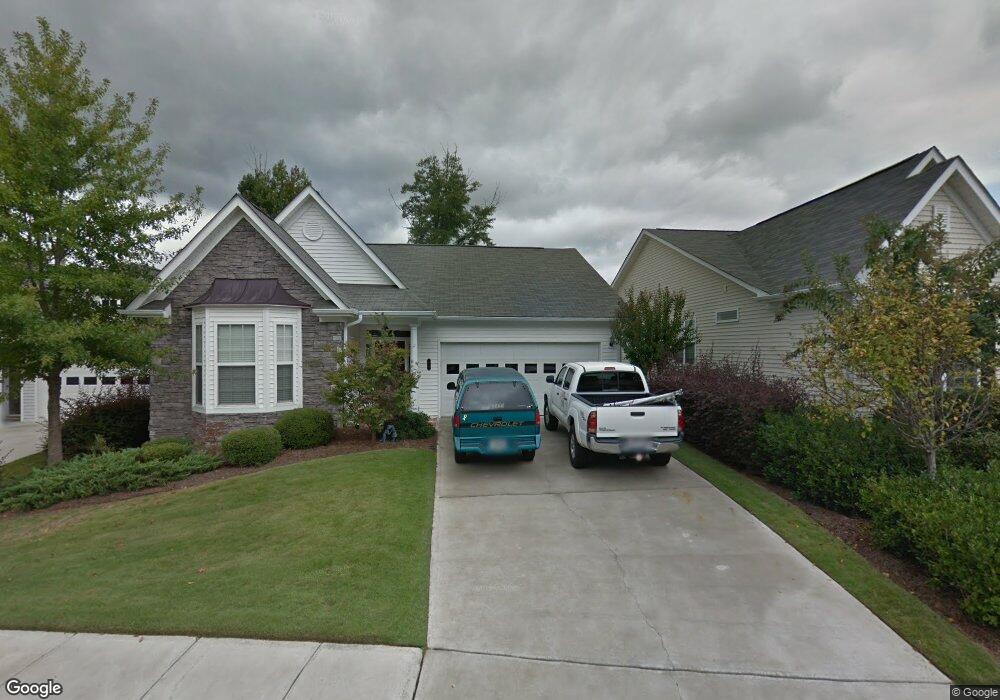
49 Williams Pride Way Newnan, GA 30265
Estimated Value: $339,757 - $362,000
3
Beds
2
Baths
1,868
Sq Ft
$189/Sq Ft
Est. Value
About This Home
This home is located at 49 Williams Pride Way, Newnan, GA 30265 and is currently estimated at $352,939, approximately $188 per square foot. 49 Williams Pride Way is a home located in Coweta County with nearby schools including White Oak Elementary School, Arnall Middle School, and East Coweta High School.
Ownership History
Date
Name
Owned For
Owner Type
Purchase Details
Closed on
Aug 20, 2021
Sold by
Lawrence Lori A
Bought by
Bryan William and Bryan Barbara
Current Estimated Value
Purchase Details
Closed on
Mar 18, 2005
Sold by
Bob Adams Homes Inc
Bought by
Lawrence Lori A
Home Financials for this Owner
Home Financials are based on the most recent Mortgage that was taken out on this home.
Original Mortgage
$186,850
Interest Rate
4.87%
Mortgage Type
VA
Purchase Details
Closed on
Mar 16, 2005
Sold by
Bob Adams Homes Inc
Bought by
Lawrence Lori A
Home Financials for this Owner
Home Financials are based on the most recent Mortgage that was taken out on this home.
Original Mortgage
$186,850
Interest Rate
4.87%
Mortgage Type
VA
Purchase Details
Closed on
Sep 27, 2001
Bought by
Bob Adams Homes Inc
Create a Home Valuation Report for This Property
The Home Valuation Report is an in-depth analysis detailing your home's value as well as a comparison with similar homes in the area
Home Values in the Area
Average Home Value in this Area
Purchase History
| Date | Buyer | Sale Price | Title Company |
|---|---|---|---|
| Bryan William | $291,501 | -- | |
| Lawrence Lori A | $188,900 | -- | |
| Lawrence Lori A | $188,800 | -- | |
| Bob Adams Homes Inc | $2,315,000 | -- |
Source: Public Records
Mortgage History
| Date | Status | Borrower | Loan Amount |
|---|---|---|---|
| Previous Owner | Lawrence Lori A | $186,850 |
Source: Public Records
Tax History Compared to Growth
Tax History
| Year | Tax Paid | Tax Assessment Tax Assessment Total Assessment is a certain percentage of the fair market value that is determined by local assessors to be the total taxable value of land and additions on the property. | Land | Improvement |
|---|---|---|---|---|
| 2025 | $1,468 | $138,254 | $24,000 | $114,254 |
| 2024 | $1,166 | $130,630 | $24,000 | $106,630 |
| 2023 | $1,166 | $128,582 | $20,000 | $108,582 |
| 2022 | $854 | $108,860 | $20,000 | $88,860 |
| 2021 | $2,335 | $90,452 | $16,000 | $74,452 |
| 2020 | $2,386 | $90,452 | $16,000 | $74,452 |
| 2019 | $2,253 | $78,732 | $10,000 | $68,732 |
| 2018 | $2,266 | $78,732 | $10,000 | $68,732 |
| 2017 | $2,256 | $78,732 | $10,000 | $68,732 |
| 2016 | $2,116 | $73,992 | $10,000 | $63,992 |
| 2015 | $1,991 | $69,726 | $10,000 | $59,726 |
| 2014 | $1,996 | $66,882 | $10,000 | $56,882 |
Source: Public Records
Map
Nearby Homes
- 20 Hampshire Ln
- 16 Hampshire Ln
- 5 Hampshire Ln
- 134 Brookview Dr
- 53 Pebble Creek Dr
- 21 Ginger Gold Dr
- 93 Pebble Creek Dr
- 24 Brookview Dr
- 8 Kingsbrook Cove
- 291 Lora Smith Rd
- 193 Kingsbrook Cir
- 6 Scenic Hills Dr
- 2589 Lower Fayetteville Rd
- 122 Mosswood Dr
- 114 Prescott Ct
- 98 Pheasant Ridge
- 65 Yorkshire Place
- 45 Greens Ct
- 70 High Point North Dr
- 65 Mosswood Trail
- 51 Williams Pride Way
- 45 Williams Pride Way
- 41 Williams Pride Way
- 55 Williams Pride Way
- 24 Hampshire Ln Unit 96
- 22 Hampshire Ln
- 26 Hampshire Ln
- 37 Williams Pride Way
- 59 Williams Pride Way
- 28 Hampshire Ln
- 28 Hampshire Ln Unit 98
- 50 Williams Pride Way
- 52 Williams Pride Way
- 46 Williams Pride Way
- 18 Hampshire Ln
- 30 Hampshire Ln Unit 99
- 30 Hampshire Ln
- 56 Williams Pride Way
- 33 Williams Pride Way
- 42 Williams Pride Way