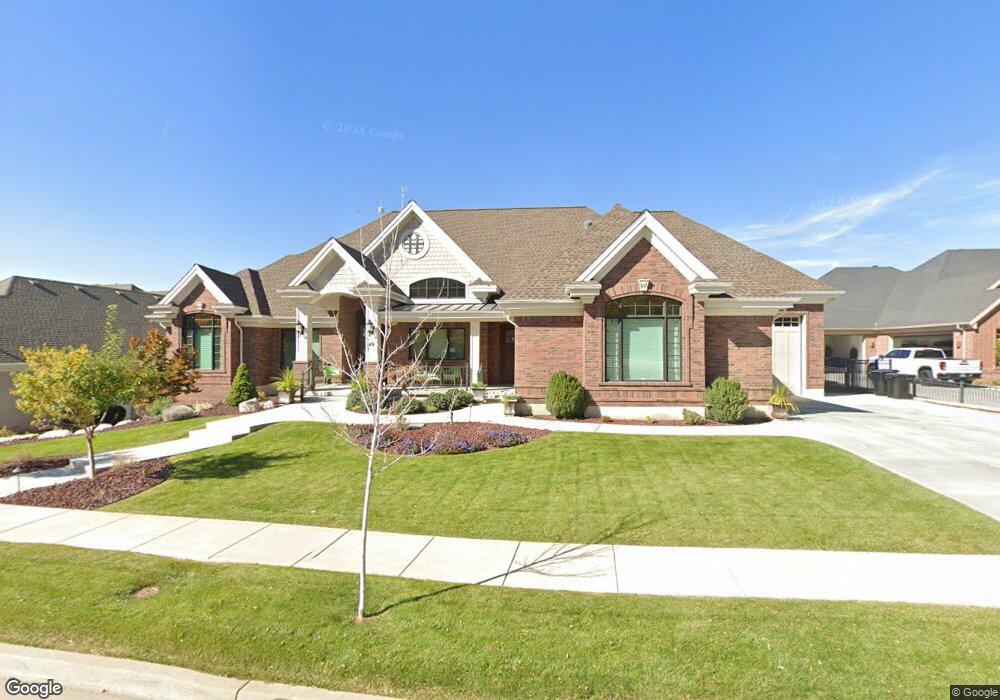
49 Windsor Ct Unit 308 Bountiful, UT 84010
Estimated Value: $1,393,000 - $1,828,732
4
Beds
4
Baths
3,563
Sq Ft
$438/Sq Ft
Est. Value
About This Home
This home is located at 49 Windsor Ct Unit 308, Bountiful, UT 84010 and is currently estimated at $1,562,183, approximately $438 per square foot. 49 Windsor Ct Unit 308 is a home located in Davis County with nearby schools including Adelaide School, South Davis Junior High School, and Woods Cross High School.
Ownership History
Date
Name
Owned For
Owner Type
Purchase Details
Closed on
Feb 24, 2020
Sold by
Humpherys Legrande Rich and Humpherys Rich
Bought by
Humpherys Legrande Rich and Humpherys Susan Joey
Current Estimated Value
Home Financials for this Owner
Home Financials are based on the most recent Mortgage that was taken out on this home.
Original Mortgage
$2,625,000
Outstanding Balance
$2,590,364
Interest Rate
3.6%
Mortgage Type
Reverse Mortgage Home Equity Conversion Mortgage
Estimated Equity
-$1,028,181
Purchase Details
Closed on
Feb 14, 2019
Sold by
Humpherys Legrande Rich and Humpherys Susan
Bought by
Humpherys L Rich and Susan Humpherys Family Trust
Purchase Details
Closed on
Mar 27, 2014
Sold by
Bunker Karen R
Bought by
The Merrill K Bunker And Karen R Bunker and Bunker Karen R
Purchase Details
Closed on
Jan 10, 2000
Sold by
Bunker Merrill K
Bought by
Bunker Karen R
Purchase Details
Closed on
Oct 27, 1998
Sold by
Stone Creek Ltd
Bought by
Bunker Merrill K
Create a Home Valuation Report for This Property
The Home Valuation Report is an in-depth analysis detailing your home's value as well as a comparison with similar homes in the area
Purchase History
| Date | Buyer | Sale Price | Title Company |
|---|---|---|---|
| Humpherys Legrande Rich | -- | Fidelity National Ttl Group | |
| Humpherys L Rich | -- | None Available | |
| The Merrill K Bunker And Karen R Bunker | -- | None Available | |
| Bunker Karen R | -- | Aspen Title Insurance Agency | |
| Bunker Merrill K | -- | -- |
Source: Public Records
Mortgage History
| Date | Status | Borrower | Loan Amount |
|---|---|---|---|
| Open | Humpherys Legrande Rich | $2,625,000 |
Source: Public Records
Tax History
| Year | Tax Paid | Tax Assessment Tax Assessment Total Assessment is a certain percentage of the fair market value that is determined by local assessors to be the total taxable value of land and additions on the property. | Land | Improvement |
|---|---|---|---|---|
| 2025 | $9,357 | $931,700 | $225,189 | $706,511 |
| 2024 | $8,904 | $900,900 | $205,826 | $695,074 |
| 2023 | $8,288 | $1,517,000 | $397,397 | $1,119,603 |
| 2022 | $7,881 | $790,350 | $215,115 | $575,235 |
| 2021 | $6,974 | $1,072,000 | $321,893 | $750,107 |
| 2020 | $6,301 | $980,000 | $292,536 | $687,464 |
| 2019 | $6,598 | $1,002,099 | $160,728 | $841,371 |
| 2018 | $6,577 | $988,000 | $226,948 | $761,052 |
| 2016 | $4,223 | $343,970 | $207,743 | $136,227 |
| 2015 | $4,952 | $377,715 | $377,715 | $0 |
| 2014 | $4,793 | $377,715 | $377,715 | $0 |
| 2013 | -- | $220,975 | $220,975 | $0 |
Source: Public Records
Map
Nearby Homes
- 136 E Fairway Dr
- 53 N Foxhill Rd
- 3893 S Bountiful Blvd
- 294 Springridge Dr
- 348 Hidden Lake Dr
- 348 Hidden Lake Dr Unit 107
- 3716 S Oakridge Cir
- 90 Scenic Hills Cir
- 407 Hidden Lake Dr
- 8 E 3500 S
- 41 Acorn Dr
- 336 W 3500 S
- 683 Hillside Oak Cir
- 3285 S Davis Blvd
- 178 N Valley View Dr
- 310 N 675 E
- 424 E Canyon Estates Dr S
- 468 W 3200 S
- 3279 Plum Tree Ln
- 568 S Tanglewood Loop Unit 1328
- 65 Windsor Ct
- 35 Windsor Ct
- 56 Windsor Ct
- 56 Windsor Ct Unit 303
- 68 Windsor Ct
- 68 Windsor Ct Unit 304
- 42 Windsor Ct
- 42 Windsor Ct Unit 302
- 4161 Monarch Dr
- 4161 Monarch Dr Unit 222
- 4085 Monarch Dr
- 4085 Monarch Dr Unit 223
- 21 Windsor Ct
- 4085 Monarch Dr
- 4233 Monarch Dr
- 28 Windsor Ct
- 28 Windsor Ct Unit 301
- 82 Windsor Ct
- 4029 Monarch Dr
- 4029 Monarch Dr Unit 224
Your Personal Tour Guide
Ask me questions while you tour the home.