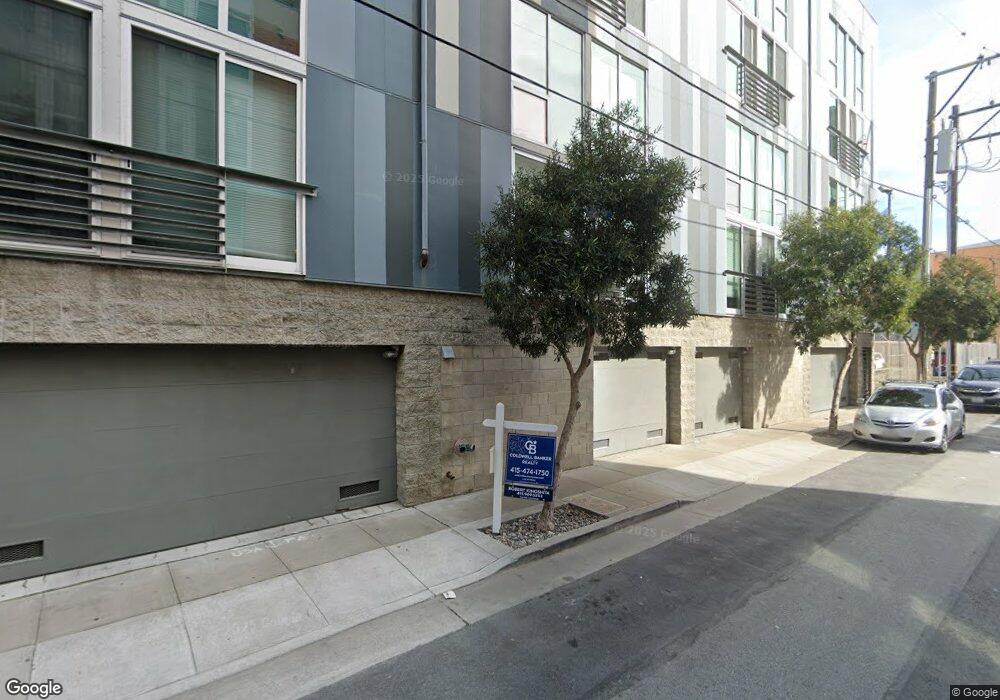
49 Zoe St Unit 1 San Francisco, CA 94107
South Beach NeighborhoodEstimated Value: $517,733 - $955,000
1
Bed
1
Bath
694
Sq Ft
$1,023/Sq Ft
Est. Value
About This Home
This home is located at 49 Zoe St Unit 1, San Francisco, CA 94107 and is currently estimated at $710,244, approximately $1,023 per square foot. 49 Zoe St Unit 1 is a home located in San Francisco County with nearby schools including Daniel Webster Elementary School, James Lick Middle School, and Five Keys Charter School.
Ownership History
Date
Name
Owned For
Owner Type
Purchase Details
Closed on
May 9, 2002
Sold by
Ogin Bruce and Ogin Sandra R
Bought by
Ogin Shara
Current Estimated Value
Home Financials for this Owner
Home Financials are based on the most recent Mortgage that was taken out on this home.
Original Mortgage
$215,800
Outstanding Balance
$82,663
Interest Rate
5.75%
Estimated Equity
$627,581
Purchase Details
Closed on
Apr 25, 2002
Sold by
Evjen David
Bought by
Ogin Shara and Ogin Bruce
Home Financials for this Owner
Home Financials are based on the most recent Mortgage that was taken out on this home.
Original Mortgage
$215,800
Outstanding Balance
$82,663
Interest Rate
5.75%
Estimated Equity
$627,581
Purchase Details
Closed on
May 21, 1997
Sold by
Evjen Thelma
Bought by
Evjen David
Home Financials for this Owner
Home Financials are based on the most recent Mortgage that was taken out on this home.
Original Mortgage
$155,000
Interest Rate
4.95%
Create a Home Valuation Report for This Property
The Home Valuation Report is an in-depth analysis detailing your home's value as well as a comparison with similar homes in the area
Home Values in the Area
Average Home Value in this Area
Purchase History
| Date | Buyer | Sale Price | Title Company |
|---|---|---|---|
| Ogin Shara | -- | Fidelity National Title Co | |
| Ogin Shara | $332,000 | Fidelity National Title Co | |
| Evjen David | -- | Old Republic Title Company | |
| Evjen David | $194,000 | Old Republic Title Company |
Source: Public Records
Mortgage History
| Date | Status | Borrower | Loan Amount |
|---|---|---|---|
| Open | Ogin Shara | $215,800 | |
| Previous Owner | Evjen David | $155,000 |
Source: Public Records
Tax History Compared to Growth
Tax History
| Year | Tax Paid | Tax Assessment Tax Assessment Total Assessment is a certain percentage of the fair market value that is determined by local assessors to be the total taxable value of land and additions on the property. | Land | Improvement |
|---|---|---|---|---|
| 2025 | $6,340 | $490,416 | $245,208 | $245,208 |
| 2024 | $6,340 | $480,802 | $240,401 | $240,401 |
| 2023 | $6,235 | $471,378 | $235,689 | $235,689 |
| 2022 | $6,102 | $462,136 | $231,068 | $231,068 |
| 2021 | $5,989 | $453,076 | $226,538 | $226,538 |
| 2020 | $6,031 | $448,432 | $224,216 | $224,216 |
| 2019 | $5,826 | $439,642 | $219,821 | $219,821 |
| 2018 | $5,630 | $431,024 | $215,512 | $215,512 |
| 2017 | $5,264 | $422,574 | $211,287 | $211,287 |
| 2016 | $5,155 | $414,290 | $207,145 | $207,145 |
| 2015 | $5,088 | $408,068 | $204,034 | $204,034 |
| 2014 | $4,954 | $400,078 | $200,039 | $200,039 |
Source: Public Records
Map
Nearby Homes
- 188 S Park St Unit 3
- 555 4th St Unit 528
- 555 4th St Unit 905
- 601 4th St Unit 304
- 1 Bluxome St Unit 317
- 414 Bryant St
- 177 Townsend St Unit 728
- 766 Harrison St Unit 711
- 766 Harrison St Unit 202
- 260 King St Unit 261
- 260 King St Unit 909
- 260 King St Unit 529
- 260 King St Unit 683
- 260 King St Unit 1107
- 260 King St Unit 631
- 260 King St Unit 741
- 170 King St Unit 618
- 461 2nd St Unit 461T
- 461 2nd St Unit 558T
- 461 2nd St Unit 302C
- 49 Zoe St Unit A
- 49 Zoe St Unit 13
- 49 Zoe St Unit 6
- 49 Zoe St Unit 4
- 49 Zoe St Unit 2
- 49 Zoe St Unit 14
- 49 Zoe St
- 49 Zoe St Unit 15
- 49 Zoe St Unit 9
- 49 Zoe St Unit 3
- 49 Zoe St Unit 16
- 49 Zoe St Unit 12
- 49 Zoe St Unit 11
- 49 Zoe St Unit 10
- 49 Zoe St Unit 8
- 49 Zoe St Unit 7
- 49 Zoe St Unit 5
- 33 Zoe St
- 35 Zoe St
- 230 Ritch St