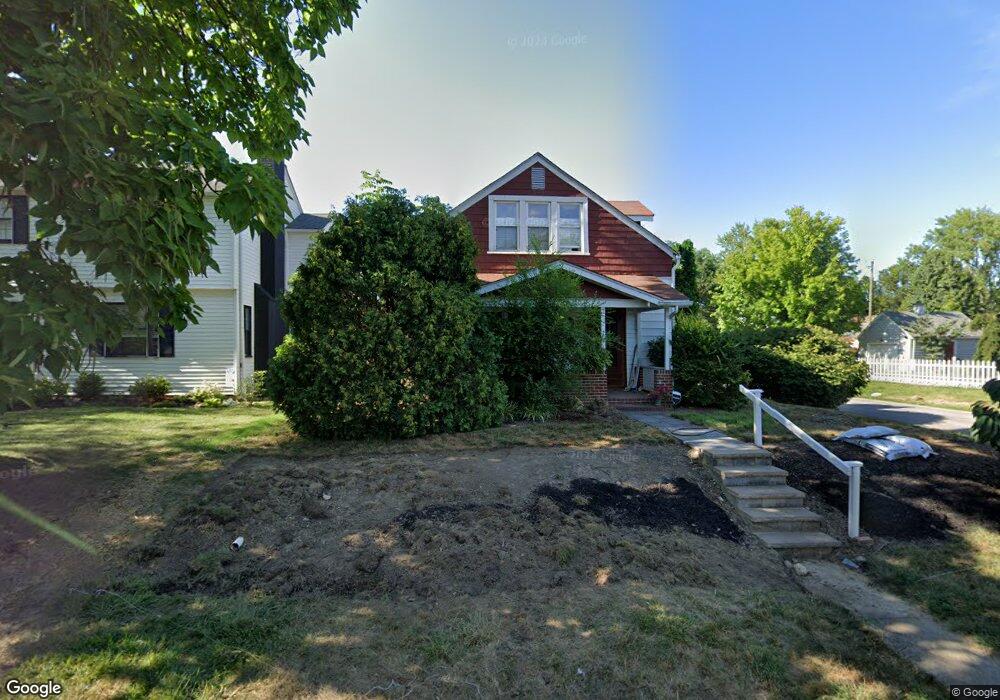
490 Crestview Rd Columbus, OH 43202
Clintonville NeighborhoodEstimated Value: $345,854 - $378,000
2
Beds
2
Baths
1,171
Sq Ft
$309/Sq Ft
Est. Value
About This Home
This home is located at 490 Crestview Rd, Columbus, OH 43202 and is currently estimated at $361,714, approximately $308 per square foot. 490 Crestview Rd is a home located in Franklin County with nearby schools including Clinton Elementary School, Dominion Middle School, and Whetstone High School.
Ownership History
Date
Name
Owned For
Owner Type
Purchase Details
Closed on
Feb 1, 2022
Sold by
Eva Lavonne Prall Living Trust
Bought by
Frausto Valli R
Current Estimated Value
Purchase Details
Closed on
Nov 1, 2002
Sold by
Prall Eva Lavonne
Bought by
Prall Eva Lavonne and Eva Lavonne Living Trust
Purchase Details
Closed on
Aug 13, 2002
Sold by
Hedge Linda F and Randall Eugene
Bought by
Prall Eva Lavonne
Purchase Details
Closed on
Feb 19, 1999
Sold by
Rench Steven R and Rench Shelley A
Bought by
Hedge Linda Fay
Home Financials for this Owner
Home Financials are based on the most recent Mortgage that was taken out on this home.
Original Mortgage
$90,000
Interest Rate
6.92%
Purchase Details
Closed on
Mar 18, 1997
Sold by
Cunningham Henry P
Bought by
Rench Steven R and Rench Shelley A
Home Financials for this Owner
Home Financials are based on the most recent Mortgage that was taken out on this home.
Original Mortgage
$109,151
Interest Rate
7.95%
Mortgage Type
FHA
Purchase Details
Closed on
Jul 16, 1987
Create a Home Valuation Report for This Property
The Home Valuation Report is an in-depth analysis detailing your home's value as well as a comparison with similar homes in the area
Home Values in the Area
Average Home Value in this Area
Purchase History
| Date | Buyer | Sale Price | Title Company |
|---|---|---|---|
| Frausto Valli R | -- | Mad Law Llc | |
| Prall Eva Lavonne | -- | -- | |
| Prall Eva Lavonne | $135,900 | -- | |
| Hedge Linda Fay | $120,000 | Transohio Title | |
| Rench Steven R | $109,900 | -- | |
| -- | $45,000 | -- |
Source: Public Records
Mortgage History
| Date | Status | Borrower | Loan Amount |
|---|---|---|---|
| Previous Owner | Hedge Linda Fay | $90,000 | |
| Previous Owner | Rench Steven R | $109,151 |
Source: Public Records
Tax History
| Year | Tax Paid | Tax Assessment Tax Assessment Total Assessment is a certain percentage of the fair market value that is determined by local assessors to be the total taxable value of land and additions on the property. | Land | Improvement |
|---|---|---|---|---|
| 2025 | $3,985 | $98,600 | $35,840 | $62,760 |
| 2024 | $3,985 | $98,600 | $35,840 | $62,760 |
| 2023 | $3,962 | $98,595 | $35,840 | $62,755 |
| 2022 | $4,189 | $78,830 | $26,500 | $52,330 |
| 2021 | $4,197 | $78,830 | $26,500 | $52,330 |
| 2020 | $4,203 | $78,830 | $26,500 | $52,330 |
| 2019 | $3,707 | $59,610 | $20,370 | $39,240 |
| 2018 | $1,850 | $59,610 | $20,370 | $39,240 |
| 2017 | $3,706 | $59,610 | $20,370 | $39,240 |
| 2016 | $3,646 | $53,660 | $16,980 | $36,680 |
| 2015 | $1,659 | $53,660 | $16,980 | $36,680 |
| 2014 | $3,327 | $53,660 | $16,980 | $36,680 |
| 2013 | $1,616 | $52,850 | $16,170 | $36,680 |
Source: Public Records
Map
Nearby Homes
- 2836-2838 Indianola Ave Unit 2836
- 580 Crestview Rd
- 555 E Weber Rd
- 415 Glen Echo Cir
- 2733 Beulah Rd
- 2680 Deming Ave
- 296 Walhalla Rd
- 534 Walhalla Rd
- 363 E Hudson St Unit 365
- 759 E Longview Ave
- 589 Clinton Heights Ave
- 2569 Audubon Rd
- 109 E Arcadia Ave
- 2593 Osceola Ave
- 53 Olentangy St
- 2458- 2458 1 2 Deming Ave
- 3035 Audubon Rd
- 61 Tibet Rd
- 2560 Osceola Ave
- 2395 Summit St Unit 397
- 484 Crestview Rd
- 480 Crestview Rd
- 502 Crestview Rd
- 474 Crestview Rd
- 495 E Tulane Rd
- 489 E Tulane Rd
- 508 Crestview Rd
- 483 Crestview Rd
- 485 E Tulane Rd
- 468 Crestview Rd
- 507 E Tulane Rd
- 2839 Kensington Place W
- 479 E Tulane Rd
- 501 Crestview Rd
- 514 Crestview Rd
- 513 E Tulane Rd
- 475 E Tulane Rd
- 2830 Kensington Place E
- 2835 Kensington Place W
- 518 Crestview Rd
Your Personal Tour Guide
Ask me questions while you tour the home.