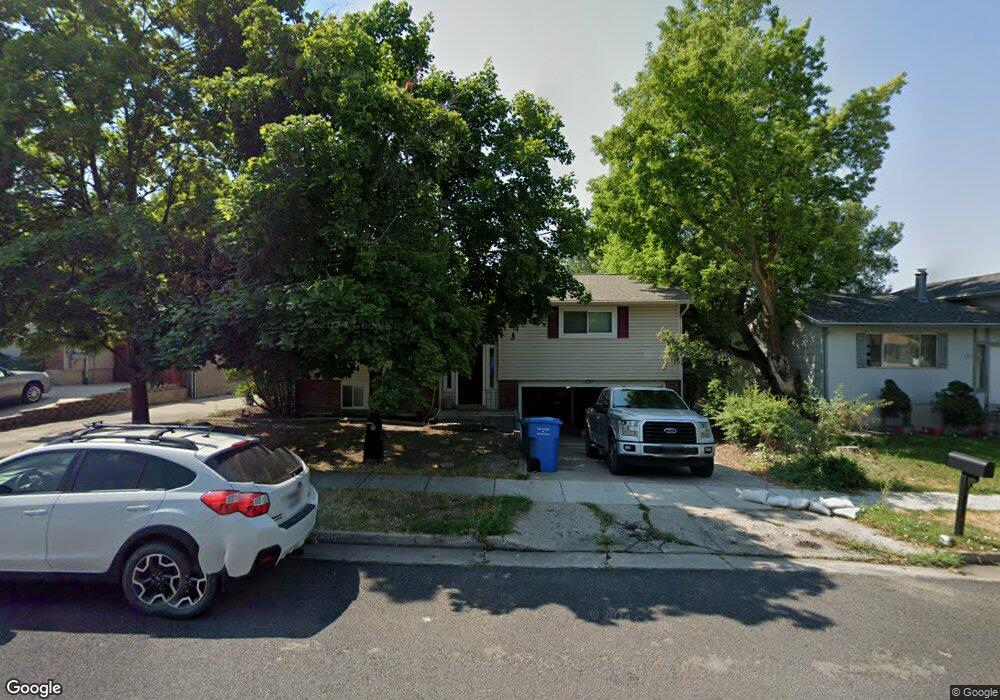
490 E 1200 N Logan, UT 84341
Adams NeighborhoodEstimated Value: $404,000 - $465,000
4
Beds
2
Baths
1,694
Sq Ft
$249/Sq Ft
Est. Value
About This Home
This home is located at 490 E 1200 N, Logan, UT 84341 and is currently estimated at $421,467, approximately $248 per square foot. 490 E 1200 N is a home located in Cache County with nearby schools including Adams Elementary School, Mount Logan Middle School, and Logan High School.
Ownership History
Date
Name
Owned For
Owner Type
Purchase Details
Closed on
Sep 20, 2021
Sold by
Barkey Brandon L
Bought by
Walneck William Isaac and Offret Amy Jo
Current Estimated Value
Home Financials for this Owner
Home Financials are based on the most recent Mortgage that was taken out on this home.
Original Mortgage
$362,598
Outstanding Balance
$328,715
Interest Rate
2.7%
Mortgage Type
FHA
Estimated Equity
$92,752
Purchase Details
Closed on
Jan 12, 2017
Sold by
Kraus Brett and Kraus Danielle
Bought by
Barkey Brandon L
Home Financials for this Owner
Home Financials are based on the most recent Mortgage that was taken out on this home.
Original Mortgage
$171,063
Interest Rate
4.25%
Mortgage Type
FHA
Purchase Details
Closed on
Mar 21, 2011
Sold by
Cluff Tyler and Cluff Jennifer
Bought by
Kraus Brett and Kraus Danielle
Home Financials for this Owner
Home Financials are based on the most recent Mortgage that was taken out on this home.
Original Mortgage
$126,216
Interest Rate
4.87%
Mortgage Type
FHA
Create a Home Valuation Report for This Property
The Home Valuation Report is an in-depth analysis detailing your home's value as well as a comparison with similar homes in the area
Home Values in the Area
Average Home Value in this Area
Purchase History
| Date | Buyer | Sale Price | Title Company |
|---|---|---|---|
| Walneck William Isaac | -- | Cache Title Logan | |
| Barkey Brandon L | -- | Advanced Title | |
| Kraus Brett | -- | American Secure Title Logan |
Source: Public Records
Mortgage History
| Date | Status | Borrower | Loan Amount |
|---|---|---|---|
| Open | Walneck William Isaac | $362,598 | |
| Previous Owner | Barkey Brandon L | $171,063 | |
| Previous Owner | Kraus Brett | $126,216 |
Source: Public Records
Tax History
| Year | Tax Paid | Tax Assessment Tax Assessment Total Assessment is a certain percentage of the fair market value that is determined by local assessors to be the total taxable value of land and additions on the property. | Land | Improvement |
|---|---|---|---|---|
| 2025 | $1,952 | $252,450 | $0 | $0 |
| 2024 | $2,015 | $252,450 | $0 | $0 |
| 2023 | $2,103 | $251,075 | $0 | $0 |
| 2022 | $1,882 | $209,825 | $0 | $0 |
| 2021 | $1,596 | $275,000 | $50,000 | $225,000 |
| 2020 | $1,532 | $237,500 | $50,000 | $187,500 |
| 2019 | $1,471 | $218,239 | $50,000 | $168,239 |
| 2018 | $1,422 | $192,576 | $50,000 | $142,576 |
| 2017 | $1,300 | $93,115 | $0 | $0 |
| 2016 | $1,348 | $76,560 | $0 | $0 |
| 2015 | $1,110 | $76,560 | $0 | $0 |
| 2014 | $978 | $74,640 | $0 | $0 |
| 2013 | -- | $74,640 | $0 | $0 |
Source: Public Records
Map
Nearby Homes
- 1188 N 600 E
- 1007 Bonneville Ave
- 359 E 1075 N
- 1177 N 680 E
- 1167 N 680 E
- 633 E 1260 N
- 648 E 1280 N
- 643 E 1280 N
- 1238 E Talmage Ln Unit 33
- 1366 N Talmage Ln Unit 35
- 1367 E 1280 N
- 1261 E Talmage Ln Unit 59
- 1241 E Talmage Ln Unit 31
- 1246 E Talmage Ln Unit 32
- 252 E 1000 N
- 871 N 700 E
- 732 N 500 E
- 395 E 1530 N
- 462 E 700 N
- 239 E 1530 N
Your Personal Tour Guide
Ask me questions while you tour the home.