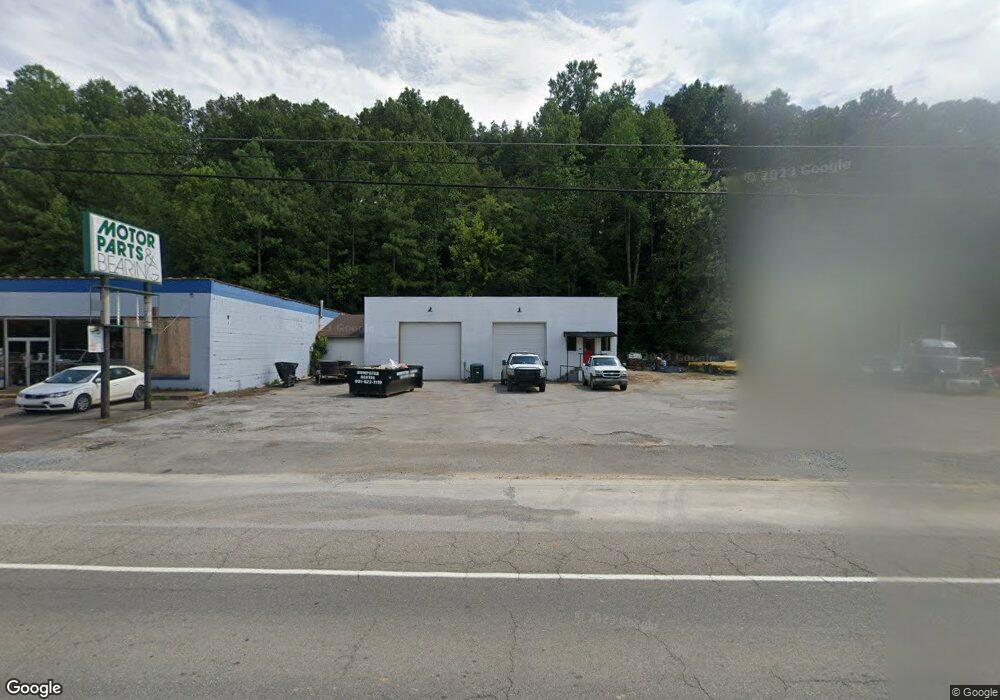
490 W Main St Waverly, TN 37185
Estimated Value: $180,038
--
Bed
--
Bath
2,972
Sq Ft
$61/Sq Ft
Est. Value
About This Home
This home is located at 490 W Main St, Waverly, TN 37185 and is currently estimated at $180,038, approximately $60 per square foot. 490 W Main St is a home located in Humphreys County.
Ownership History
Date
Name
Owned For
Owner Type
Purchase Details
Closed on
Mar 10, 2023
Sold by
Valker Chad and Valker Bonnie
Bought by
Hl Services Llc
Current Estimated Value
Home Financials for this Owner
Home Financials are based on the most recent Mortgage that was taken out on this home.
Original Mortgage
$155,250
Outstanding Balance
$83,546
Interest Rate
6.13%
Mortgage Type
New Conventional
Estimated Equity
$96,492
Purchase Details
Closed on
Feb 7, 2022
Sold by
Johnson Aaron
Bought by
Valker Chad and Valker Bonnie
Purchase Details
Closed on
Aug 9, 2021
Sold by
Motor Parts & Bearing Co Of New Johnsonv
Bought by
Valker Chad and Valker Bonnie
Home Financials for this Owner
Home Financials are based on the most recent Mortgage that was taken out on this home.
Original Mortgage
$40,500
Interest Rate
3%
Mortgage Type
Purchase Money Mortgage
Purchase Details
Closed on
Aug 14, 2002
Sold by
Auto & Mill Supply Co
Bought by
Motor Parts & Bearing Co
Purchase Details
Closed on
May 12, 1989
Bought by
Motor Parts & Bearing Co Of Waverly Tn
Purchase Details
Closed on
Dec 31, 1983
Bought by
Auto & Mill Supply Co
Purchase Details
Closed on
Jan 19, 1967
Create a Home Valuation Report for This Property
The Home Valuation Report is an in-depth analysis detailing your home's value as well as a comparison with similar homes in the area
Home Values in the Area
Average Home Value in this Area
Purchase History
| Date | Buyer | Sale Price | Title Company |
|---|---|---|---|
| Hl Services Llc | $159,000 | -- | |
| Valker Chad | $6,628 | None Listed On Document | |
| Valker Chad | $45,000 | None Available | |
| Motor Parts & Bearing Co | -- | -- | |
| Motor Parts & Bearing Co Of Waverly Tn | -- | -- | |
| Auto & Mill Supply Co | -- | -- | |
| -- | -- | -- |
Source: Public Records
Mortgage History
| Date | Status | Borrower | Loan Amount |
|---|---|---|---|
| Open | Hl Services Llc | $155,250 | |
| Previous Owner | Valker Chad | $40,500 |
Source: Public Records
Tax History Compared to Growth
Tax History
| Year | Tax Paid | Tax Assessment Tax Assessment Total Assessment is a certain percentage of the fair market value that is determined by local assessors to be the total taxable value of land and additions on the property. | Land | Improvement |
|---|---|---|---|---|
| 2024 | $933 | $30,600 | $26,000 | $4,600 |
| 2023 | $933 | $30,600 | $26,000 | $4,600 |
| 2022 | $954 | $29,720 | $26,280 | $3,440 |
| 2021 | $954 | $29,720 | $26,280 | $3,440 |
| 2020 | $954 | $29,720 | $26,280 | $3,440 |
| 2019 | $968 | $29,400 | $26,000 | $3,400 |
| 2018 | $968 | $29,400 | $26,000 | $3,400 |
| 2017 | $968 | $29,400 | $26,000 | $3,400 |
| 2016 | $1,258 | $35,360 | $32,040 | $3,320 |
| 2015 | $1,258 | $35,360 | $32,040 | $3,320 |
| 2014 | $1,259 | $35,367 | $0 | $0 |
Source: Public Records
Map
Nearby Homes
- 437 W Main St
- 202 Bowen Heights Dr
- 206 Collier Ave
- 3158 W Trace Creek Rd
- 221 Carroll Ave
- 314 N Maple Ave
- 312 N Maple Ave
- 0 Mill St
- Lot #18 Foxwood Dr
- 0 Bear Hollow Dr Unit RTC3002566
- 0 Bear Hollow Dr Unit 24022394
- 0 Bear Hollow Dr Unit 24022393
- 0 Bear Hollow Dr Unit RTC2817194
- 0 Bear Hollow Dr Unit RTC2747935
- 107 W End Dr
- 520 Young Rd
- 213 E Wyly St
- 1 Main St W
- 201 Park Cir
- 106 Dupont Ave
- 456 W Main St
- 507 W Main St
- 505 W Main St
- 121 Bowen Heights Dr
- 439 W Main St
- 504 W Main St
- 203 Bowen Heights Dr
- 437A W Main St
- 102 Collier Ave
- 205 Bowen Heights Dr
- 106 Collier Ave
- 0 Bowen Heights Dr
- 207 Bowen Heights Dr
- 435 W Main St
- 433 W Main St
- 431 W Main St
- 211 Bowen Heights Dr
- 105 Hillcrest Dr
- 429 W Main St
- 601 W Main St