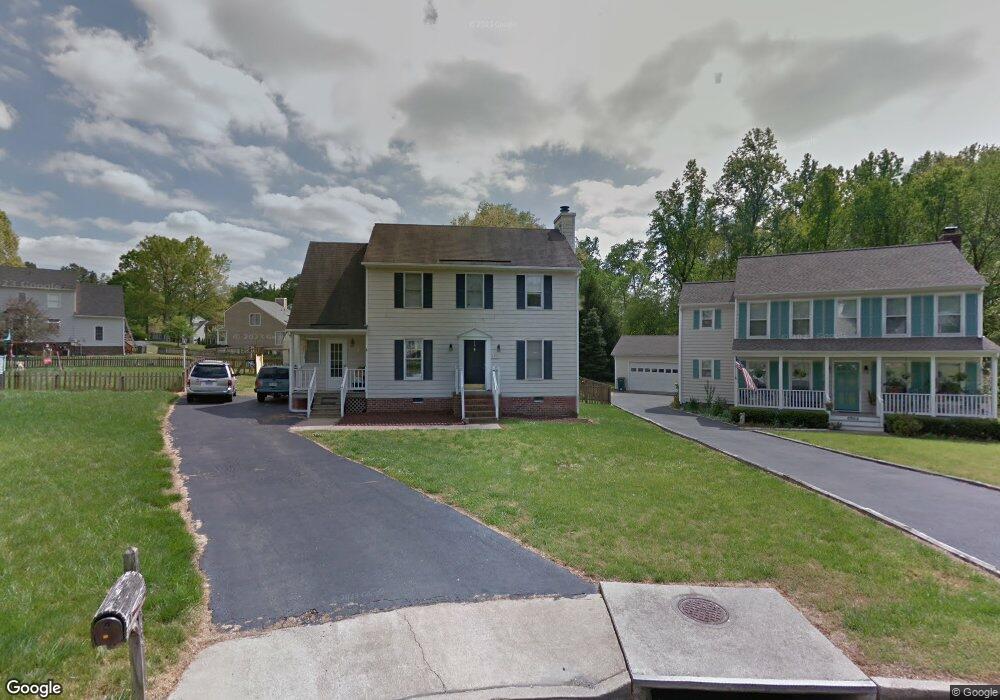
4900 Castle Point Ct Glen Allen, VA 23060
Echo Lake NeighborhoodEstimated Value: $412,315 - $430,000
3
Beds
3
Baths
1,590
Sq Ft
$264/Sq Ft
Est. Value
About This Home
This home is located at 4900 Castle Point Ct, Glen Allen, VA 23060 and is currently estimated at $419,579, approximately $263 per square foot. 4900 Castle Point Ct is a home located in Henrico County with nearby schools including Echo Lake Elementary School, Hungary Creek Middle School, and Glen Allen High School.
Ownership History
Date
Name
Owned For
Owner Type
Purchase Details
Closed on
Apr 8, 2005
Sold by
Jani Kalpesh
Bought by
Decola George
Current Estimated Value
Home Financials for this Owner
Home Financials are based on the most recent Mortgage that was taken out on this home.
Original Mortgage
$194,500
Outstanding Balance
$99,056
Interest Rate
5.78%
Mortgage Type
New Conventional
Estimated Equity
$320,523
Purchase Details
Closed on
Mar 21, 2002
Sold by
Relocation Resources Intl
Bought by
Jani Kalpesh S
Home Financials for this Owner
Home Financials are based on the most recent Mortgage that was taken out on this home.
Original Mortgage
$147,750
Interest Rate
6.91%
Mortgage Type
FHA
Purchase Details
Closed on
Dec 28, 1999
Sold by
Reese Chad A and Reese L
Bought by
Riddick Brian J and Riddick Carrie L
Home Financials for this Owner
Home Financials are based on the most recent Mortgage that was taken out on this home.
Original Mortgage
$120,650
Interest Rate
7.61%
Mortgage Type
New Conventional
Create a Home Valuation Report for This Property
The Home Valuation Report is an in-depth analysis detailing your home's value as well as a comparison with similar homes in the area
Home Values in the Area
Average Home Value in this Area
Purchase History
| Date | Buyer | Sale Price | Title Company |
|---|---|---|---|
| Decola George | $149,500 | -- | |
| Jani Kalpesh S | $150,000 | -- | |
| Relocation Resources Intl | $150,000 | -- | |
| Riddick Brian J | $127,000 | -- |
Source: Public Records
Mortgage History
| Date | Status | Borrower | Loan Amount |
|---|---|---|---|
| Open | Decola George | $194,500 | |
| Previous Owner | Riddick Brian J | $147,750 | |
| Previous Owner | Riddick Brian J | $120,650 |
Source: Public Records
Tax History Compared to Growth
Tax History
| Year | Tax Paid | Tax Assessment Tax Assessment Total Assessment is a certain percentage of the fair market value that is determined by local assessors to be the total taxable value of land and additions on the property. | Land | Improvement |
|---|---|---|---|---|
| 2025 | $2,931 | $336,400 | $95,000 | $241,400 |
| 2024 | $2,931 | $313,200 | $90,000 | $223,200 |
| 2023 | $2,662 | $313,200 | $90,000 | $223,200 |
| 2022 | $2,485 | $292,300 | $73,000 | $219,300 |
| 2021 | $2,345 | $257,700 | $62,000 | $195,700 |
| 2020 | $2,242 | $257,700 | $62,000 | $195,700 |
| 2019 | $2,191 | $251,800 | $62,000 | $189,800 |
| 2018 | $2,127 | $244,500 | $62,000 | $182,500 |
| 2017 | $2,028 | $233,100 | $58,000 | $175,100 |
| 2016 | $1,907 | $219,200 | $50,000 | $169,200 |
| 2015 | $1,830 | $219,200 | $50,000 | $169,200 |
| 2014 | $1,830 | $210,400 | $50,000 | $160,400 |
Source: Public Records
Map
Nearby Homes
- 9000 Castle Point Dr
- 9015 Covewood Rd
- 5116 Linsey Lakes Dr
- 10717 Smith Point Way
- 9324 Crystal Brook Terrace
- 9301 Crystal Brook Terrace
- 463 Burden Dr
- 8007 Lake Laurel Ln Unit A
- 461 Burden Dr
- 8001 Lake Laurel Ln Unit A
- Matisse Plan at Laurel Oaks Condos
- Picasso Plan at Laurel Oaks Condos
- 453 Burden Dr
- 8005 Lake Laurel Ln Unit A
- 8025 Lake Laurel Ln Unit B
- 6009 Topping Ln
- 1 Chapman Mill Dr
- 0 Chapman Mill Dr
- 3513 Gwynns Place
- 4603 Candlelight Ct
- 4904 Castle Point Ct
- 4901 Castle Point Ct
- 9032 Merlin Ct
- 9028 Merlin Ct
- 4905 Castle Point Ct
- 4908 Castle Point Ct
- 9024 Merlin Ct
- 4909 Castle Point Ct
- 9036 Merlin Ct
- 4912 Castle Point Ct
- 4915 Castle Point Ct
- 9031 Arthur Ct
- 9035 Arthur Ct
- 4916 Castle Point Ct
- 4919 Castle Point Ct
- 9033 Merlin Ct
- 9016 Merlin Ct
- 4920 Castle Point Ct
- 9036 Arthur Ct
- 4923 Castle Point Ct