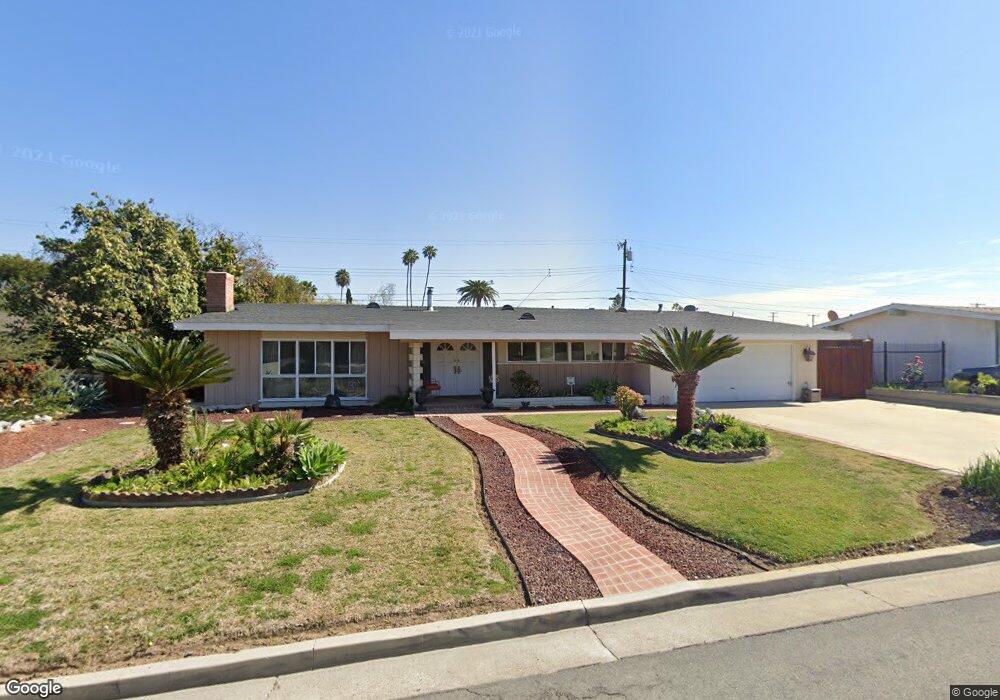
4900 Ridglea Ave Buena Park, CA 90621
Estimated Value: $1,162,965 - $1,250,000
3
Beds
2
Baths
2,284
Sq Ft
$527/Sq Ft
Est. Value
About This Home
This home is located at 4900 Ridglea Ave, Buena Park, CA 90621 and is currently estimated at $1,202,991, approximately $526 per square foot. 4900 Ridglea Ave is a home located in Orange County with nearby schools including Gordon H. Beatty Elementary School, Buena Park Junior High School, and Sunny Hills High School.
Ownership History
Date
Name
Owned For
Owner Type
Purchase Details
Closed on
Aug 24, 2016
Sold by
Nicholas Mary Ann V
Bought by
The Mary Ann V Nicholas Revocable Living
Current Estimated Value
Purchase Details
Closed on
Mar 9, 1993
Sold by
Davis Hubert E
Bought by
Nicholas Mary Ann
Home Financials for this Owner
Home Financials are based on the most recent Mortgage that was taken out on this home.
Original Mortgage
$161,250
Interest Rate
7.83%
Purchase Details
Closed on
Feb 16, 1993
Sold by
England Robert
Bought by
Nicholas Mary Ann
Home Financials for this Owner
Home Financials are based on the most recent Mortgage that was taken out on this home.
Original Mortgage
$161,250
Interest Rate
7.83%
Create a Home Valuation Report for This Property
The Home Valuation Report is an in-depth analysis detailing your home's value as well as a comparison with similar homes in the area
Home Values in the Area
Average Home Value in this Area
Purchase History
| Date | Buyer | Sale Price | Title Company |
|---|---|---|---|
| The Mary Ann V Nicholas Revocable Living | -- | None Available | |
| Nicholas Mary Ann | $215,000 | Continental Lawyers Title Co | |
| Nicholas Mary Ann | -- | Continental Lawyers Title Co |
Source: Public Records
Mortgage History
| Date | Status | Borrower | Loan Amount |
|---|---|---|---|
| Closed | Nicholas Mary Ann | $161,250 |
Source: Public Records
Tax History Compared to Growth
Tax History
| Year | Tax Paid | Tax Assessment Tax Assessment Total Assessment is a certain percentage of the fair market value that is determined by local assessors to be the total taxable value of land and additions on the property. | Land | Improvement |
|---|---|---|---|---|
| 2025 | $4,266 | $372,732 | $240,962 | $131,770 |
| 2024 | $4,266 | $365,424 | $236,237 | $129,187 |
| 2023 | $4,176 | $358,259 | $231,605 | $126,654 |
| 2022 | $4,107 | $351,235 | $227,064 | $124,171 |
| 2021 | $4,075 | $344,349 | $222,612 | $121,737 |
| 2020 | $4,024 | $340,819 | $220,330 | $120,489 |
| 2019 | $3,929 | $334,137 | $216,010 | $118,127 |
| 2018 | $3,853 | $327,586 | $211,775 | $115,811 |
| 2017 | $3,797 | $321,163 | $207,622 | $113,541 |
| 2016 | $3,721 | $314,866 | $203,551 | $111,315 |
| 2015 | $3,561 | $310,137 | $200,494 | $109,643 |
| 2014 | $3,547 | $304,062 | $196,566 | $107,496 |
Source: Public Records
Map
Nearby Homes
- 4738 Durango Dr
- 8244 Henderson Green
- 4900 Lincolnshire Ave
- 5211 Fox Hills Ave
- 5412 Arrowhead Ave
- 14806 Faceta Dr
- 14724 Mercado Ave
- 14828 Rayfield Dr
- 2150 Cheyenne Way Unit 169
- 8237 Henshaw Cir
- 2200 Cheyenne Way Unit 117
- 15213 Santa Gertrudes Ave Unit W106
- 15233 Santa Gertrudes Ave
- 8542 Emerywood Dr
- 15220 Ocaso Ave Unit H103
- 15224 Ocaso Ave Unit H212
- 5588 Cajon Ave
- 15011 La Mesa Dr
- 5471 Jonesboro Way
- 9 Coveside Ct
- 4882 Ridglea Ave
- 4920 Ridglea Ave
- 4901 Somerset St
- 4861 Saint Andrews Ave
- 4921 Somerset St
- 4891 Ridglea Ave
- 4901 Ridglea Ave
- 4938 Ridglea Ave
- 4841 Saint Andrews Ave
- 4881 Ridglea Ave
- 4921 Ridglea Ave
- 4935 Somerset St
- 4941 Ridglea Ave
- 4861 Ridglea Ave
- 4900 Somerset St
- 4926 Argyle Way
- 4920 Argyle Way
- 4958 Ridglea Ave
- 4932 Argyle Way
- 4938 Argyle Dr