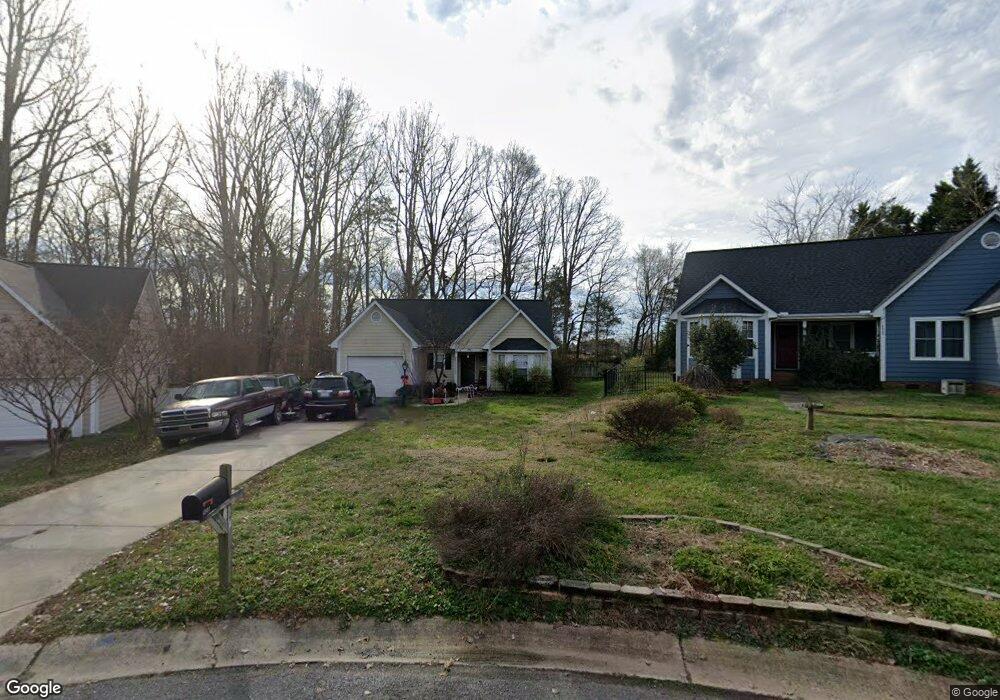
4901 Spring Meadow Ln Monroe, NC 28110
Estimated Value: $285,000 - $297,000
2
Beds
2
Baths
990
Sq Ft
$292/Sq Ft
Est. Value
About This Home
This home is located at 4901 Spring Meadow Ln, Monroe, NC 28110 and is currently estimated at $289,198, approximately $292 per square foot. 4901 Spring Meadow Ln is a home located in Union County with nearby schools including Shiloh Valley Primary School, Shiloh Valley Elementary School, and Sun Valley Middle School.
Ownership History
Date
Name
Owned For
Owner Type
Purchase Details
Closed on
Feb 21, 2022
Sold by
Elizabeth Spurr Claire and Elizabeth Jared Daniel
Bought by
Coulson Claire Elizabeth
Current Estimated Value
Home Financials for this Owner
Home Financials are based on the most recent Mortgage that was taken out on this home.
Original Mortgage
$150,000
Outstanding Balance
$138,999
Interest Rate
3.69%
Mortgage Type
New Conventional
Estimated Equity
$150,199
Purchase Details
Closed on
Jan 25, 2005
Sold by
Robinson Seth
Bought by
Spurr Claire E
Home Financials for this Owner
Home Financials are based on the most recent Mortgage that was taken out on this home.
Original Mortgage
$104,176
Interest Rate
5.66%
Mortgage Type
FHA
Purchase Details
Closed on
Dec 19, 1997
Sold by
Hill Holland Page
Bought by
Robinson Seth A
Create a Home Valuation Report for This Property
The Home Valuation Report is an in-depth analysis detailing your home's value as well as a comparison with similar homes in the area
Purchase History
| Date | Buyer | Sale Price | Title Company |
|---|---|---|---|
| Coulson Claire Elizabeth | -- | None Listed On Document | |
| Spurr Claire E | $105,000 | -- | |
| Robinson Seth A | $90,000 | -- |
Source: Public Records
Mortgage History
| Date | Status | Borrower | Loan Amount |
|---|---|---|---|
| Open | Coulson Claire Elizabeth | $150,000 | |
| Previous Owner | Spurr Claire E | $104,176 |
Source: Public Records
Tax History
| Year | Tax Paid | Tax Assessment Tax Assessment Total Assessment is a certain percentage of the fair market value that is determined by local assessors to be the total taxable value of land and additions on the property. | Land | Improvement |
|---|---|---|---|---|
| 2025 | $1,568 | $232,000 | $0 | $0 |
| 2024 | $1,551 | $179,000 | $36,300 | $142,700 |
| 2023 | $1,530 | $179,000 | $36,300 | $142,700 |
| 2022 | $1,498 | $179,000 | $36,300 | $142,700 |
| 2021 | $1,497 | $179,000 | $36,300 | $142,700 |
| 2020 | $823 | $105,000 | $22,500 | $82,500 |
| 2019 | $1,115 | $105,000 | $22,500 | $82,500 |
| 2018 | $0 | $105,000 | $22,500 | $82,500 |
| 2017 | $1,167 | $105,000 | $22,500 | $82,500 |
| 2016 | $1,128 | $105,000 | $22,500 | $82,500 |
| 2015 | $902 | $105,000 | $22,500 | $82,500 |
| 2014 | $744 | $102,160 | $25,000 | $77,160 |
Source: Public Records
Map
Nearby Homes
- 2300 Grayson Pkwy
- 200 Sidney Ct
- 3001 Kansas City Dr
- 6004 Brook Valley Run
- 5303 Rogers Rd
- 2006 Great Falls Dr
- 1035 Barnette Farm Ln
- 1110 Hinson Forest Rd
- 1032 Barnette Farm Ln
- 2614 Grayson Pkwy
- 4003 Salmon River Dr
- 5412 Fulton Ridge Dr
- 3035 Proverbs Ct
- 104 Pine Lake Dr
- 1302 Langdon Terrace Dr
- 4080 Holly Villa Cir
- 3043 Streamlet Way
- 4063 Holly Villa Cir
- 5607 Fulton Ridge Dr
- 3010 Council Fire Cir
- 4903 Spring Meadow Ln
- 4900 Spring Meadow Ln
- 4902 Hunters Knoll Dr
- 4905 Spring Meadow Ln
- 4902 Spring Meadow Ln
- 4904 Hunters Knoll Dr
- 4909 Spring Meadow Ln
- 4904 Spring Meadow Ln
- 4906 Spring Meadow Ln
- 4906 Hunters Knoll Dr
- 4911 Spring Meadow Ln
- 4910 Spring Meadow Ln
- 4908 Hunters Knoll Dr
- 4901 Hunters Knoll Dr
- 4913 Spring Meadow Ln
- 4912 Spring Meadow Ln
- 4908 Spring Meadow Ln
- 4912 Rogers Rd
- 4903 Hunters Knoll Dr
- 4910 Hunters Knoll Dr
Your Personal Tour Guide
Ask me questions while you tour the home.