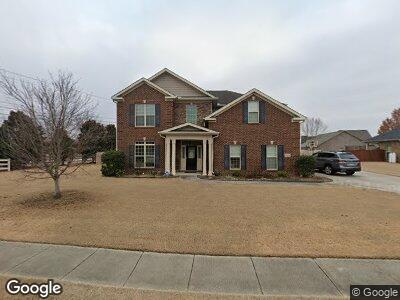
4902 Tree Cove Ln SE Owens Cross Roads, AL 35763
Hampton Cove NeighborhoodEstimated Value: $512,000 - $539,603
4
Beds
3
Baths
2,859
Sq Ft
$184/Sq Ft
Est. Value
About This Home
This home is located at 4902 Tree Cove Ln SE, Owens Cross Roads, AL 35763 and is currently estimated at $527,151, approximately $184 per square foot. 4902 Tree Cove Ln SE is a home located in Madison County with nearby schools including Goldsmith-Schiffman Elementary School, Hampton Cove Middle School, and Huntsville High School.
Ownership History
Date
Name
Owned For
Owner Type
Purchase Details
Closed on
Aug 5, 2022
Sold by
Heather Fitzgerald
Bought by
Cohen Sean
Current Estimated Value
Home Financials for this Owner
Home Financials are based on the most recent Mortgage that was taken out on this home.
Original Mortgage
$318,118
Outstanding Balance
$307,759
Interest Rate
5.51%
Mortgage Type
VA
Estimated Equity
$215,368
Purchase Details
Closed on
Nov 23, 2010
Sold by
Pearson Homes Inc
Bought by
Cohen Heather F and Cohen Sean
Home Financials for this Owner
Home Financials are based on the most recent Mortgage that was taken out on this home.
Original Mortgage
$272,669
Interest Rate
4.25%
Mortgage Type
FHA
Purchase Details
Closed on
Sep 17, 2008
Sold by
Hampton Cove Land Company Inc
Bought by
D R Horton Inc
Purchase Details
Closed on
Sep 15, 2008
Sold by
D R Horton Inc
Bought by
Ashtynn Manor Properties Llc
Purchase Details
Closed on
Jan 5, 2006
Sold by
Hampton Cove Land Company Inc
Bought by
D R Horton Inc
Create a Home Valuation Report for This Property
The Home Valuation Report is an in-depth analysis detailing your home's value as well as a comparison with similar homes in the area
Home Values in the Area
Average Home Value in this Area
Purchase History
| Date | Buyer | Sale Price | Title Company |
|---|---|---|---|
| Cohen Sean | $11,000 | Boston National Title | |
| Cohen Heather F | -- | -- | |
| D R Horton Inc | -- | -- | |
| Ashtynn Manor Properties Llc | -- | -- | |
| D R Horton Inc | -- | -- |
Source: Public Records
Mortgage History
| Date | Status | Borrower | Loan Amount |
|---|---|---|---|
| Open | Cohen Sean | $318,118 | |
| Previous Owner | Cohen Sean | $286,000 | |
| Previous Owner | Cohen Heather F | $272,669 | |
| Previous Owner | Pearson Homes Inc | $225,600 |
Source: Public Records
Tax History Compared to Growth
Tax History
| Year | Tax Paid | Tax Assessment Tax Assessment Total Assessment is a certain percentage of the fair market value that is determined by local assessors to be the total taxable value of land and additions on the property. | Land | Improvement |
|---|---|---|---|---|
| 2024 | $2,912 | $51,040 | $7,500 | $43,540 |
| 2023 | $2,912 | $49,780 | $7,500 | $42,280 |
| 2022 | $2,379 | $41,840 | $5,500 | $36,340 |
| 2021 | $1,919 | $33,920 | $4,500 | $29,420 |
| 2020 | $1,793 | $31,730 | $4,000 | $27,730 |
| 2019 | $1,728 | $30,620 | $4,000 | $26,620 |
| 2018 | $1,701 | $30,160 | $0 | $0 |
| 2017 | $1,701 | $30,160 | $0 | $0 |
| 2016 | $1,701 | $30,160 | $0 | $0 |
| 2015 | $1,701 | $30,160 | $0 | $0 |
| 2014 | $1,692 | $30,000 | $0 | $0 |
Source: Public Records
Map
Nearby Homes
- 6713 Zach Ln SE
- 4905 SE Ashley Cir
- 6701 Mceachern Ln SE
- 468 Wade Rd SE
- 7019 Ridge Crest Rd SE Unit LOT 45
- Lot 1 Wade Rd
- 5005 Creekstone Dr SE
- 4814 Creston Ct SE
- 7019 Southgate Dr SE
- 7014 Ridge Crest Rd SE Unit LOT40
- 7012 Ridge Crest Rd SE Unit LOT 41
- 7106 Kingsbridge Ln SE
- 7010 Ridge Crest Rd SE
- 4814 Inglewood Ct SE
- 7043 Ridge Crest Rd SE
- 4810 Inglewood Ct SE
- 7206 Dorchester Dr SE
- 4805 Saddle Ridge Dr SE
- 4728 Saddle Ridge Dr SE
- 4715 Carrington Blvd SE
- 4902 Tree Cove Ln SE
- 6717 Mceachern Ln SE
- 6719 Mceachern Ln SE
- 5000 Frankford Dr SE
- 5405 Frankford Dr SE
- 6721 Mceachern Ln SE
- 4903 Tree Cove Ln SE
- 5403 Frankford Dr SE
- 4905 Tree Cove Ln SE
- 6709 Mceachern Ln SE
- 5401 Frankford Dr SE
- 5001 Frankford Dr SE
- 6716 Mceachern Ln SE
- 6718 Mceachern Ln SE
- 6714 Mceachern Ln SE
- 5321 Frankford Dr SE
- 6720 Mceachern Ln SE
- 6723 Mceachern Ln SE
- 5003 Frankford Dr SE
- 4902 Ashley Cir SE