
Seller's Agent in 2025
Jaime Ashley Campos
RE/MAX
(708) 715-7258
10 in this area
372 Total Sales
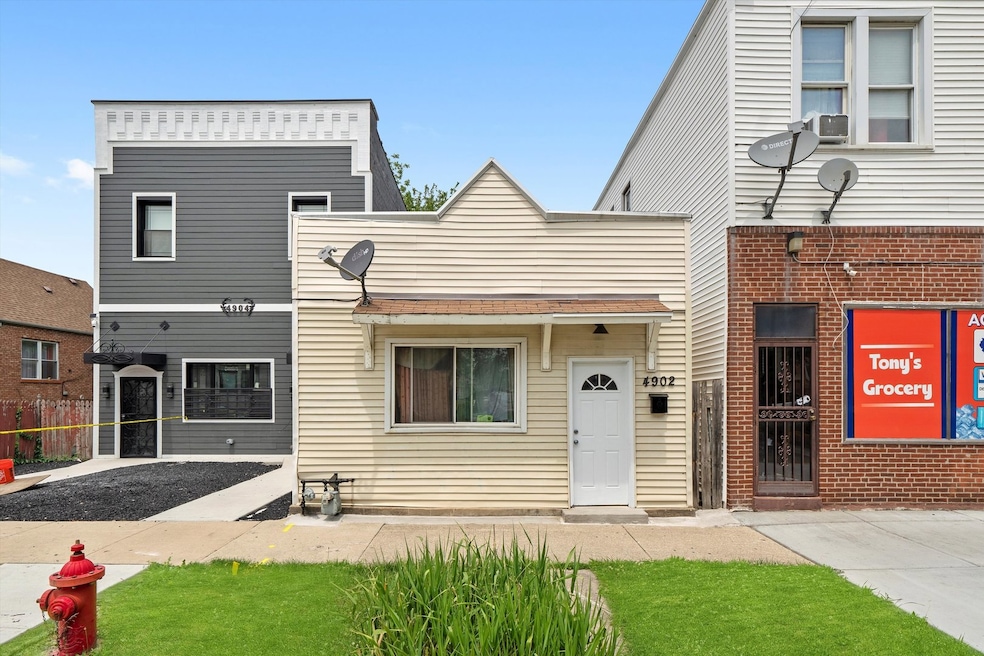


Charming 2 bed, 1 bath single-family home featuring a spacious living room, formal dining room, and generous backyard-ideal for relaxing or entertaining. Perfect for owner-occupants looking for a comfortable home in a well-connected area, or investors seeking a solid rental property with great potential. Located near key transit options including the Cicero Metra (BNSF Line) and CTA Pink Line, making downtown commutes a breeze. Enjoy easy access to parks, schools, and shopping, including Cicero Marketplace, Hawthorne Park District, and the Cicero Aquatic Center. With its practical layout and prime location, this home offers both comfort and value. Schedule your showing today!
Last Agent to Sell the Property
RE/MAX LOYALTY License #475157922 Listed on: 06/16/2025
| Date | Type | Sale Price | Title Company |
|---|---|---|---|
| Warranty Deed | $140,000 | None Listed On Document | |
| Warranty Deed | -- | Stewart Title Company | |
| Legal Action Court Order | -- | None Available | |
| Warranty Deed | $125,000 | First American Title Ins Co | |
| Warranty Deed | $70,000 | Pntn |
| Date | Status | Loan Amount | Loan Type |
|---|---|---|---|
| Previous Owner | $125,800 | New Conventional | |
| Previous Owner | $123,068 | FHA | |
| Previous Owner | $66,500 | Unknown |
| Date | Event | Price | List to Sale | Price per Sq Ft |
|---|---|---|---|---|
| 08/22/2025 08/22/25 | Sold | $140,000 | -6.7% | $236 / Sq Ft |
| 06/26/2025 06/26/25 | Pending | -- | -- | -- |
| 06/16/2025 06/16/25 | For Sale | $150,000 | -- | $253 / Sq Ft |
| Year | Tax Paid | Tax Assessment Tax Assessment Total Assessment is a certain percentage of the fair market value that is determined by local assessors to be the total taxable value of land and additions on the property. | Land | Improvement |
|---|---|---|---|---|
| 2024 | $3,276 | $13,001 | $2,688 | $10,313 |
| 2023 | $1,200 | $13,001 | $2,688 | $10,313 |
| 2022 | $1,200 | $6,171 | $2,313 | $3,858 |
| 2021 | $1,225 | $6,169 | $2,312 | $3,857 |
| 2020 | $1,287 | $6,169 | $2,312 | $3,857 |
| 2019 | $1,069 | $5,589 | $2,125 | $3,464 |
| 2018 | $1,038 | $5,589 | $2,125 | $3,464 |
| 2017 | $1,029 | $5,589 | $2,125 | $3,464 |
| 2016 | $1,576 | $5,737 | $1,750 | $3,987 |
| 2015 | $1,497 | $5,737 | $1,750 | $3,987 |
| 2014 | $1,466 | $5,737 | $1,750 | $3,987 |
| 2013 | $934 | $4,864 | $1,750 | $3,114 |
Seller's Agent in 2025
Jaime Ashley Campos
RE/MAX
(708) 715-7258
10 in this area
372 Total Sales
I
Buyer's Agent in 2025
Isaias Vargas
Realty of America, LLC
(708) 788-1900
2 in this area
23 Total Sales
Source: Midwest Real Estate Data (MRED)
MLS Number: 12388431
APN: 16-28-424-025-0000
Disclaimer: Certain information contained herein is derived from information provided by parties other than Homes.com. All information provided is deemed reliable, but is not guaranteed to be accurate and should be independently verified.
![]() Based on information submitted to the MLS GRID. All data is obtained from various sources and may not have been verified by broker or MLS GRID. Supplied Open House Information is subject to change without notice. All information should be independently reviewed and verified for accuracy. Properties may or may not be listed by the office/agent presenting the information. Some IDX listings have been excluded from this website.
Based on information submitted to the MLS GRID. All data is obtained from various sources and may not have been verified by broker or MLS GRID. Supplied Open House Information is subject to change without notice. All information should be independently reviewed and verified for accuracy. Properties may or may not be listed by the office/agent presenting the information. Some IDX listings have been excluded from this website.
The Digital Millennium Copyright Act of 1998, 17 U.S.C. § 512 (the “DMCA”) provides recourse for copyright owners who believe that material appearing on the Internet infringes their rights under U.S. copyright law. If you believe in good faith that any content or material made available in connection with our website or services infringes your copyright, you (or your agent) may send us a notice requesting that the content or material be removed, or access to it blocked.
Notices must be sent in writing by email to DMCAnotice@MLSGrid.com.
The DMCA requires that your notice of alleged copyright infringement include the following information:
(1) description of the copyrighted work that is the subject of claimed infringement;
(2) description of the alleged infringing content and information sufficient to permit us to locate the content;
(3) contact information for you, including your address, telephone number and email address;
(4) a statement by you that you have a good faith belief that the content in the manner complained of is not authorized by the copyright owner, or its agent, or by the operation of any law;
(5) a statement by you, signed under penalty of perjury, that the information in the notification is accurate and that you have the authority to enforce the copyrights that are claimed to be infringed; and
(6) a physical or electronic signature of the copyright owner or a person authorized to act on the copyright owner’s behalf. Failure to include all of the above information may result in the delay of the processing of your complaint.