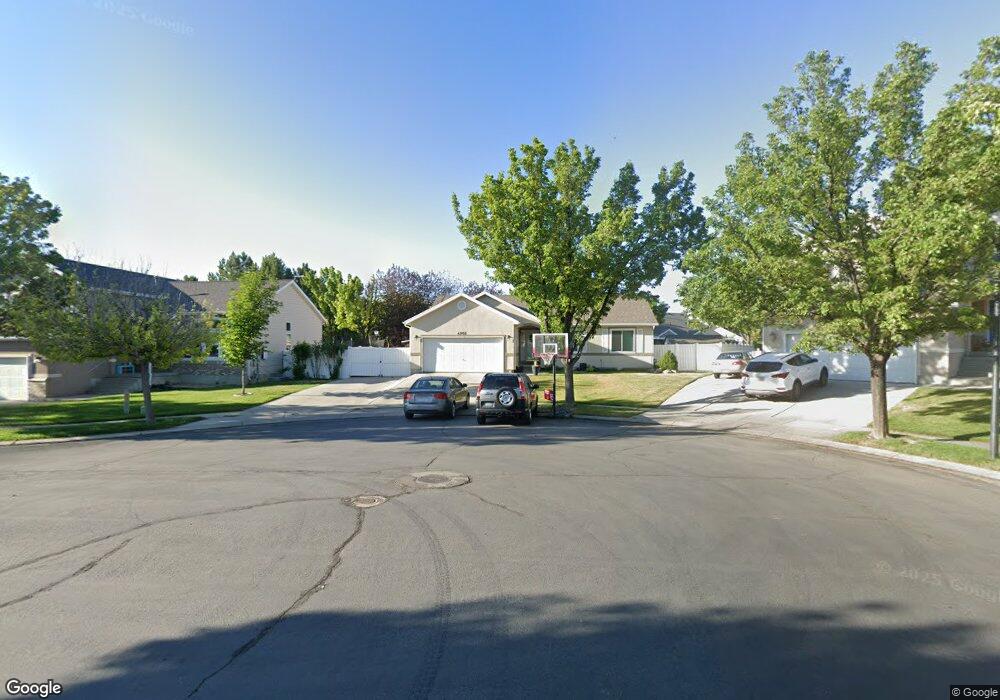
4903 Village Glen Cir West Jordan, UT 84081
Shadow Mountain NeighborhoodEstimated Value: $554,217 - $610,000
3
Beds
2
Baths
1,265
Sq Ft
$457/Sq Ft
Est. Value
About This Home
This home is located at 4903 Village Glen Cir, West Jordan, UT 84081 and is currently estimated at $578,054, approximately $456 per square foot. 4903 Village Glen Cir is a home located in Salt Lake County with nearby schools including Hayden Peak Elementary School, West Hills Middle School, and Copper Hills High School.
Ownership History
Date
Name
Owned For
Owner Type
Purchase Details
Closed on
Mar 15, 2005
Sold by
Blake Steven G and Blake Lorna J
Bought by
Carlile Ryan T and Carlile Heather L
Current Estimated Value
Home Financials for this Owner
Home Financials are based on the most recent Mortgage that was taken out on this home.
Original Mortgage
$189,525
Outstanding Balance
$96,084
Interest Rate
5.61%
Mortgage Type
FHA
Estimated Equity
$481,970
Purchase Details
Closed on
Jul 21, 1999
Sold by
Blake Steven
Bought by
Blake Steven G and Blake Lorna J
Purchase Details
Closed on
May 4, 1999
Sold by
Mcarthur Homes At Park Village Lc
Bought by
Robinson Scott G and Robinson Julie L
Home Financials for this Owner
Home Financials are based on the most recent Mortgage that was taken out on this home.
Original Mortgage
$142,000
Interest Rate
6.96%
Create a Home Valuation Report for This Property
The Home Valuation Report is an in-depth analysis detailing your home's value as well as a comparison with similar homes in the area
Home Values in the Area
Average Home Value in this Area
Purchase History
| Date | Buyer | Sale Price | Title Company |
|---|---|---|---|
| Carlile Ryan T | -- | Backman Stewart Title Svcs | |
| Blake Steven G | -- | Superior Title Company | |
| Blake Steven | -- | Superior Title | |
| Robinson Scott G | -- | Surety Title |
Source: Public Records
Mortgage History
| Date | Status | Borrower | Loan Amount |
|---|---|---|---|
| Open | Carlile Ryan T | $189,525 | |
| Previous Owner | Robinson Scott G | $142,000 |
Source: Public Records
Tax History Compared to Growth
Tax History
| Year | Tax Paid | Tax Assessment Tax Assessment Total Assessment is a certain percentage of the fair market value that is determined by local assessors to be the total taxable value of land and additions on the property. | Land | Improvement |
|---|---|---|---|---|
| 2025 | $2,690 | $521,400 | $150,000 | $371,400 |
| 2024 | $2,690 | $517,600 | $144,200 | $373,400 |
| 2023 | $2,582 | $468,100 | $138,700 | $329,400 |
| 2022 | $2,674 | $477,100 | $136,000 | $341,100 |
| 2021 | $2,363 | $383,800 | $104,600 | $279,200 |
| 2020 | $2,237 | $340,900 | $96,200 | $244,700 |
| 2019 | $2,192 | $327,600 | $90,800 | $236,800 |
| 2018 | $2,016 | $298,800 | $90,800 | $208,000 |
| 2017 | $1,848 | $272,700 | $90,800 | $181,900 |
| 2016 | $1,657 | $229,700 | $95,300 | $134,400 |
| 2015 | $1,672 | $226,100 | $102,100 | $124,000 |
| 2014 | $1,632 | $217,200 | $98,800 | $118,400 |
Source: Public Records
Map
Nearby Homes
- 7502 S Lace Wood Dr Unit 417
- 7493 S Lace Wood Dr
- 7908 Cold Stone Ln Unit N3
- 7882 S Dove Creek Ln Unit A6
- 4678 Emmons Dr
- 7563 S Opal Mountain Way W Unit 306
- 7567 S Opal Mountain Way W Unit 307
- 7556 S Opal Mountain Way W Unit 311
- 7569 S Opal Mountain Way W Unit 308
- 7554 S Opal Mountain Way W Unit 310
- 7553 S Opal Mountain Way W Unit 302
- 5189 W Dove Creek Ln
- 7414 Regal Hill Dr
- 5183 W Swift Water Way
- 7973 S Nebo Dr
- 5228 W Ranches Loop Rd
- 6880 S Survey Peak Ln
- 6884 S Survey Peak Ln
- 6888 S Survey Peak Ln
- 7288 Comet Hill Cir
- 4911 Village Glen Cir
- 4891 W Village Glen Cir
- 4891 Village Glen Cir
- 7704 S Park Glen Ct
- 7704 Park Glen Ct
- 7703 Park Glen Ct
- 4912 Village Glen Cir
- 7707 Park Glen Ct
- 4881 Village Glen Cir
- 4906 Village Glen Cir
- 4896 Village Glen Cir
- 7712 Park Glen Ct
- 4898 W Village Glen Cir
- 7707 S Park Glen Ct
- 4906 W Village Glen Cir
- 7687 S 4950 W
- 7712 S Park Glen Ct
- 4884 Village Glen Cir
- 7701 S 4950 W
- 4862 W Park Wood Ct