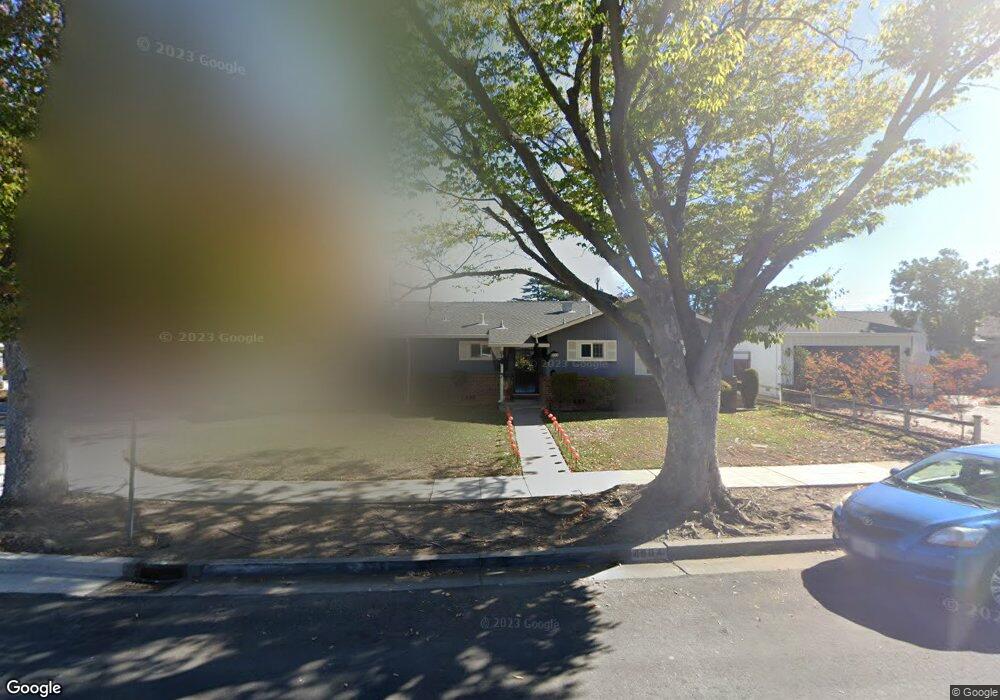
4904 Bel Escou Dr San Jose, CA 95124
De Voss-Leigh NeighborhoodEstimated Value: $1,883,000 - $2,464,000
4
Beds
2
Baths
1,570
Sq Ft
$1,451/Sq Ft
Est. Value
About This Home
This home is located at 4904 Bel Escou Dr, San Jose, CA 95124 and is currently estimated at $2,277,965, approximately $1,450 per square foot. 4904 Bel Escou Dr is a home located in Santa Clara County with nearby schools including Alta Vista Elementary School, Union Middle School, and Leigh High School.
Ownership History
Date
Name
Owned For
Owner Type
Purchase Details
Closed on
Jan 16, 2014
Sold by
Flippin Helen Joann
Bought by
Flippin Marry Ann
Current Estimated Value
Purchase Details
Closed on
May 7, 2012
Sold by
Flippin Helen Joann
Bought by
Flippin Mary Ann
Purchase Details
Closed on
Nov 21, 2011
Sold by
Flippin Ronald B and Flippin Helen Joann
Bought by
Flippin Ronald B and Flippin Helen Joann
Create a Home Valuation Report for This Property
The Home Valuation Report is an in-depth analysis detailing your home's value as well as a comparison with similar homes in the area
Home Values in the Area
Average Home Value in this Area
Purchase History
| Date | Buyer | Sale Price | Title Company |
|---|---|---|---|
| Flippin Marry Ann | -- | None Available | |
| Flippin Helen Joann | -- | None Available | |
| Flippin Mary Ann | -- | None Available | |
| Flippin Ronald B | -- | None Available |
Source: Public Records
Tax History Compared to Growth
Tax History
| Year | Tax Paid | Tax Assessment Tax Assessment Total Assessment is a certain percentage of the fair market value that is determined by local assessors to be the total taxable value of land and additions on the property. | Land | Improvement |
|---|---|---|---|---|
| 2025 | $3,395 | $145,362 | $23,297 | $122,065 |
| 2024 | $3,395 | $142,513 | $22,841 | $119,672 |
| 2023 | $3,287 | $139,720 | $22,394 | $117,326 |
| 2022 | $3,236 | $136,981 | $21,955 | $115,026 |
| 2021 | $3,117 | $134,296 | $21,525 | $112,771 |
| 2020 | $3,006 | $132,920 | $21,305 | $111,615 |
| 2019 | $2,925 | $130,315 | $20,888 | $109,427 |
| 2018 | $2,848 | $127,761 | $20,479 | $107,282 |
| 2017 | $2,801 | $125,257 | $20,078 | $105,179 |
| 2016 | $2,673 | $122,802 | $19,685 | $103,117 |
| 2015 | $2,624 | $120,959 | $19,390 | $101,569 |
| 2014 | $2,189 | $118,591 | $19,011 | $99,580 |
Source: Public Records
Map
Nearby Homes
- 1957 Wilfred Way
- 15236 Dickens Ave
- 5222 Adalina Ct
- 4848 Anna Dr
- 102 Hildebrand Dr
- 14802 Cole Dr
- 4927 Leigh Ave
- 4768 Hatfield Walk Unit 2
- 2303 Saidel Dr Unit 4
- 4787 Hatfield Walkway Unit 4
- 2026 Lynn Ave
- 2309 Saidel Dr Unit 2
- 1504 Love Ct
- 200 Westchester Dr
- 14570 Wyrick Ave
- 1507 Love Ct
- 1500 Paradise Ct
- 1502 Love Ct
- 1505 Love Ct
- 1501 Paradise Ct
- 4914 Bel Escou Dr
- 4924 Bel Escou Dr
- 15148 Bel Escou Dr
- 2008 Carlton Ave
- 4917 Union Ave
- 15149 Union Ave
- 4905 Bel Escou Dr
- 4915 Bel Escou Dr
- 4934 Bel Escou Dr
- 4929 Union Ave
- 15132 Bel Escou Dr
- 4925 Bel Escou Dr
- 15149 Bel Escou Dr
- 15133 Union Ave
- 4942 Bel Escou Dr
- 4937 Union Ave
- 4939 Union Ave Unit 2
- 4935 Bel Escou Dr
- 2042 Carlton Ave
- 15091 Carlton Ave