4904 Brannan Dr W Unit 4904 Springfield, OH 45502
Estimated Value: $177,000 - $191,000
2
Beds
2
Baths
1,252
Sq Ft
$146/Sq Ft
Est. Value
About This Home
This home is located at 4904 Brannan Dr W Unit 4904, Springfield, OH 45502 and is currently estimated at $183,100, approximately $146 per square foot. 4904 Brannan Dr W Unit 4904 is a home located in Clark County with nearby schools including Rolling Hills Elementary School, Northridge Middle School, and Kenton Ridge Middle & High School.
Ownership History
Date
Name
Owned For
Owner Type
Purchase Details
Closed on
Jun 29, 2020
Sold by
Basa Terri and Souder Keystone Ihheritance Tr
Bought by
Hinkle Cheryl L
Current Estimated Value
Home Financials for this Owner
Home Financials are based on the most recent Mortgage that was taken out on this home.
Original Mortgage
$94,400
Outstanding Balance
$83,863
Interest Rate
3.2%
Mortgage Type
New Conventional
Estimated Equity
$99,237
Purchase Details
Closed on
Dec 22, 2009
Sold by
Souder Barbara L and Souder Terrance L
Bought by
Basa Terri and The Souder Keystone Inheritanc
Purchase Details
Closed on
Sep 9, 1999
Sold by
Mclean June L
Bought by
Souder Barbara L
Home Financials for this Owner
Home Financials are based on the most recent Mortgage that was taken out on this home.
Original Mortgage
$67,000
Interest Rate
7.77%
Purchase Details
Closed on
Jun 20, 1994
Sold by
H C Bishop Inc
Bought by
Jane L Mclean
Create a Home Valuation Report for This Property
The Home Valuation Report is an in-depth analysis detailing your home's value as well as a comparison with similar homes in the area
Home Values in the Area
Average Home Value in this Area
Purchase History
| Date | Buyer | Sale Price | Title Company |
|---|---|---|---|
| Hinkle Cheryl L | $118,000 | None Available | |
| Basa Terri | -- | Attorney | |
| Souder Barbara L | $87,000 | -- | |
| Jane L Mclean | $62,845 | -- |
Source: Public Records
Mortgage History
| Date | Status | Borrower | Loan Amount |
|---|---|---|---|
| Open | Hinkle Cheryl L | $94,400 | |
| Previous Owner | Souder Barbara L | $67,000 |
Source: Public Records
Tax History Compared to Growth
Tax History
| Year | Tax Paid | Tax Assessment Tax Assessment Total Assessment is a certain percentage of the fair market value that is determined by local assessors to be the total taxable value of land and additions on the property. | Land | Improvement |
|---|---|---|---|---|
| 2024 | $1,049 | $33,980 | $6,130 | $27,850 |
| 2023 | $1,049 | $33,980 | $6,130 | $27,850 |
| 2022 | $1,071 | $33,980 | $6,130 | $27,850 |
| 2021 | $1,220 | $33,050 | $4,380 | $28,670 |
| 2020 | $1,221 | $33,050 | $4,380 | $28,670 |
| 2019 | $1,244 | $33,050 | $4,380 | $28,670 |
| 2018 | $1,043 | $28,320 | $4,990 | $23,330 |
| 2017 | $894 | $27,392 | $4,988 | $22,404 |
| 2016 | $887 | $27,392 | $4,988 | $22,404 |
| 2015 | $866 | $27,654 | $5,250 | $22,404 |
| 2014 | $866 | $27,654 | $5,250 | $22,404 |
| 2013 | $845 | $27,654 | $5,250 | $22,404 |
Source: Public Records
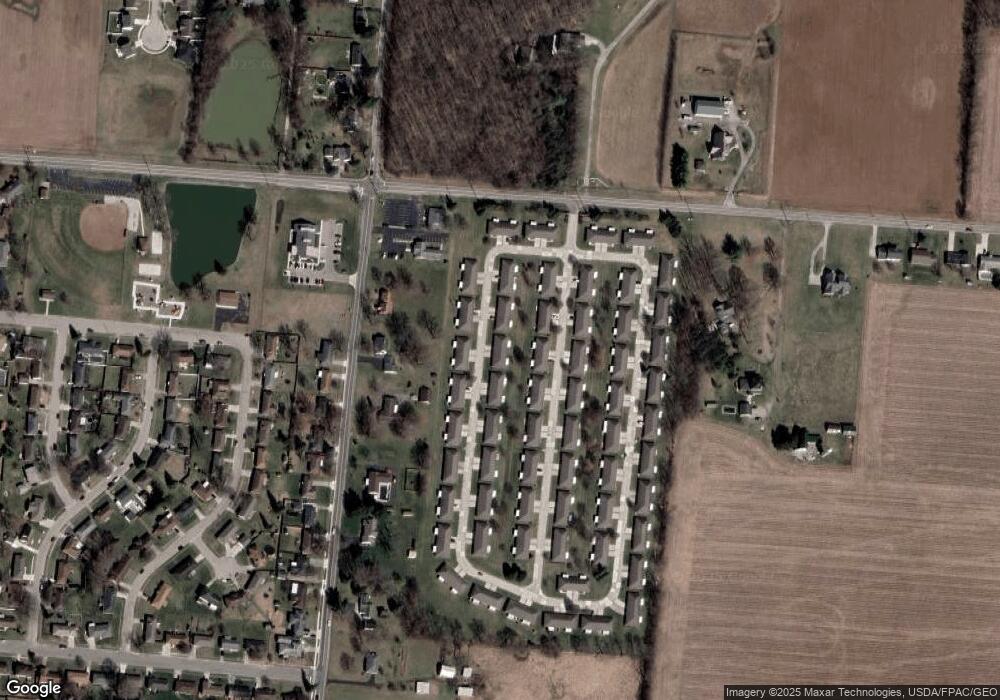
Map
Nearby Homes
- 4924 Brannan Dr E Unit 4924
- 4849 Ashley Dr
- 4644 Middle Urbana Rd
- 4800 Mesa Ln
- 4620 Eldora Dr
- 4620 Eldora St
- 1709 Thomas Dr
- 4740 Merrimont Ave
- 4825 Chippendale Dr
- 1835 Sierra Ave
- 5220 Ridgewood Rd E
- 4524 Ridgewood Rd E
- 5127 Stoneridge Dr
- 4512 Ridgewood Rd E
- 4316 Phoenix Dr
- 4321 Tulane Rd
- 4438 Tacoma St
- 4249 Reno Rd
- 4902 Brannan Dr W Unit 4902
- 4914 Brannan Dr W
- 4892 Brannan Dr W
- 4916 Brannan Dr W
- 4903 Brannan Dr W
- 4895 Auston St Unit 4895
- 4913 Brannan Dr W
- 4893 Auston St
- 4901 Brannan Dr W
- 4905 Auston St
- 4890 Brannan Dr W Unit 4890
- 4915 Brannan Dr W
- 4915 Brannan Dr W
- 4915 Brannan Dr W
- 4883 Auston St Unit 4883
- 4907 Auston St
- 4907 Auston St
- 4907 Auston St
- 4891 Brannan Dr W Unit 4891
- 4926 Brannan Dr W