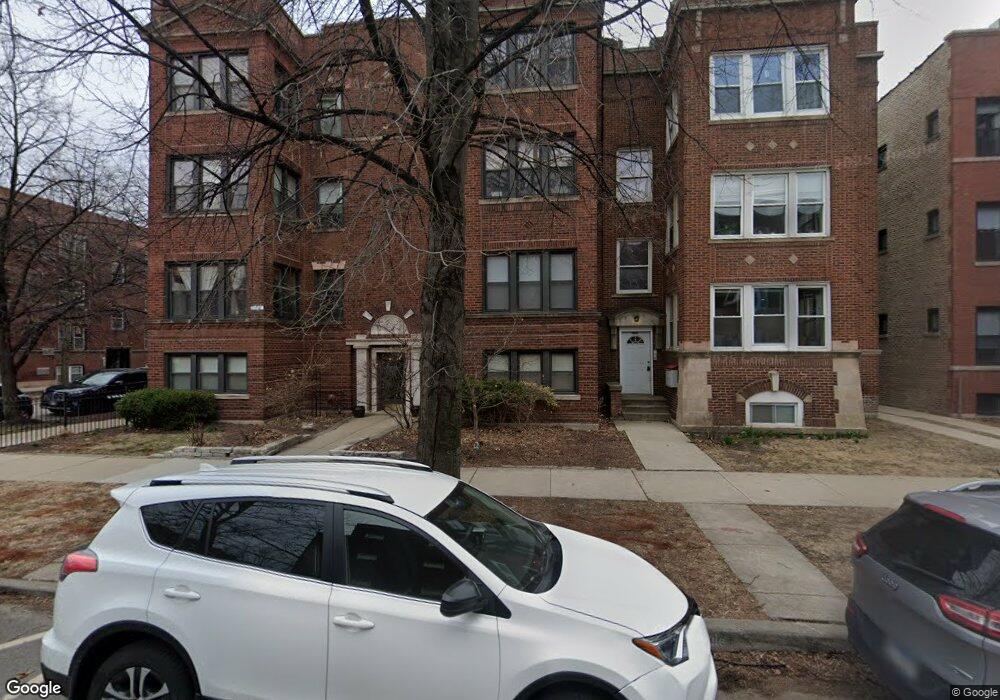
4904 N Rockwell St Unit 1NE Chicago, IL 60625
Lincoln Square NeighborhoodEstimated Value: $304,000 - $779,000
--
Bed
--
Bath
17,800
Sq Ft
$24/Sq Ft
Est. Value
About This Home
This home is located at 4904 N Rockwell St Unit 1NE, Chicago, IL 60625 and is currently estimated at $428,473, approximately $24 per square foot. 4904 N Rockwell St Unit 1NE is a home located in Cook County with nearby schools including Budlong Elementary School, Amundsen High School, and North Shore Adventist Academy.
Ownership History
Date
Name
Owned For
Owner Type
Purchase Details
Closed on
Dec 10, 2003
Sold by
Demarinis Giancarlo and Demarinis Janet
Bought by
Alexander Scott and Fletcher Thais
Current Estimated Value
Home Financials for this Owner
Home Financials are based on the most recent Mortgage that was taken out on this home.
Original Mortgage
$160,000
Interest Rate
6.04%
Mortgage Type
Unknown
Purchase Details
Closed on
Apr 28, 1999
Sold by
Thiele Christian and Thiele Bonnie
Bought by
Demarinis Giancarlo and Demarinis Janet
Home Financials for this Owner
Home Financials are based on the most recent Mortgage that was taken out on this home.
Original Mortgage
$79,600
Interest Rate
7.04%
Purchase Details
Closed on
Mar 30, 1998
Sold by
G & P Investment Management Inc
Bought by
Thiele Christian and Cooper Bonnie
Home Financials for this Owner
Home Financials are based on the most recent Mortgage that was taken out on this home.
Original Mortgage
$84,450
Interest Rate
7.15%
Create a Home Valuation Report for This Property
The Home Valuation Report is an in-depth analysis detailing your home's value as well as a comparison with similar homes in the area
Home Values in the Area
Average Home Value in this Area
Purchase History
| Date | Buyer | Sale Price | Title Company |
|---|---|---|---|
| Alexander Scott | $185,000 | First American Title | |
| Demarinis Giancarlo | $99,500 | -- | |
| Thiele Christian | $89,000 | -- |
Source: Public Records
Mortgage History
| Date | Status | Borrower | Loan Amount |
|---|---|---|---|
| Previous Owner | Alexander Scott | $160,000 | |
| Previous Owner | Demarinis Giancarlo | $79,600 | |
| Previous Owner | Thiele Christian | $84,450 |
Source: Public Records
Tax History Compared to Growth
Tax History
| Year | Tax Paid | Tax Assessment Tax Assessment Total Assessment is a certain percentage of the fair market value that is determined by local assessors to be the total taxable value of land and additions on the property. | Land | Improvement |
|---|---|---|---|---|
| 2024 | $5,119 | $26,773 | $1,634 | $25,139 |
| 2023 | $5,142 | $24,261 | $1,105 | $23,156 |
| 2022 | $5,142 | $25,000 | $1,105 | $23,895 |
| 2021 | $5,027 | $24,999 | $1,104 | $23,895 |
| 2020 | $3,069 | $13,778 | $1,104 | $12,674 |
| 2019 | $3,054 | $15,201 | $1,104 | $14,097 |
| 2018 | $3,003 | $15,201 | $1,104 | $14,097 |
| 2017 | $3,348 | $15,554 | $966 | $14,588 |
| 2016 | $3,516 | $17,556 | $966 | $16,590 |
| 2015 | $3,217 | $17,556 | $966 | $16,590 |
| 2014 | $3,656 | $19,703 | $897 | $18,806 |
| 2013 | $3,839 | $21,109 | $897 | $20,212 |
Source: Public Records
Map
Nearby Homes
- 4850 N Rockwell St
- 2527 W Argyle St
- 2720 W Gunnison St
- 2522 W Winnemac Ave
- 2607 W Carmen Ave
- 2524 W Winnemac Ave
- 4755 N Washtenaw Ave Unit P-27
- 4755 N Washtenaw Ave Unit P-25
- 4755 N Washtenaw Ave Unit P-11
- 2709 W Lawrence Ave Unit 3
- 2505 W Carmen Ave Unit 303
- 5061 N Lincoln Ave Unit 201
- 4950 N Western Ave Unit 5H
- 2700 W Carmen Ave
- 2401 W Winnemac Ave Unit 4W
- 2540 W Leland Ave Unit 2
- 4751 N Artesian Ave Unit 205
- 4751 N Artesian Ave Unit 409
- 5011 N Western Ave
- 2754 W Giddings St
- 4904 N Rockwell St Unit GN
- 4904 N Rockwell St Unit G
- 4904 N Rockwell St Unit 1N
- 4902 N Rockwell St Unit 3S
- 2606 W Ainslie St Unit 1E
- 2608 W Ainslie St Unit 1W
- 2608 W Ainslie St Unit 2W
- 4902 N Rockwell St Unit 2
- 4900 N Rockwell St Unit 2-E
- 4900 N Rockwell St Unit 3-SE
- 4900 N Rockwell St Unit 3-NE
- 4900 N Rockwell St Unit 3-W
- 4900 N Rockwell St Unit 1-SE
- 4902 N Rockwell St Unit GS
- 2606 W Ainslie St Unit 2E
- 2608 W Ainslie St Unit 3W
- 4900 N Rockwell St Unit 1S
- 4902 N Rockwell St Unit 1S
- 4906 N Rockwell St
- 4906 N Rockwell St Unit 3