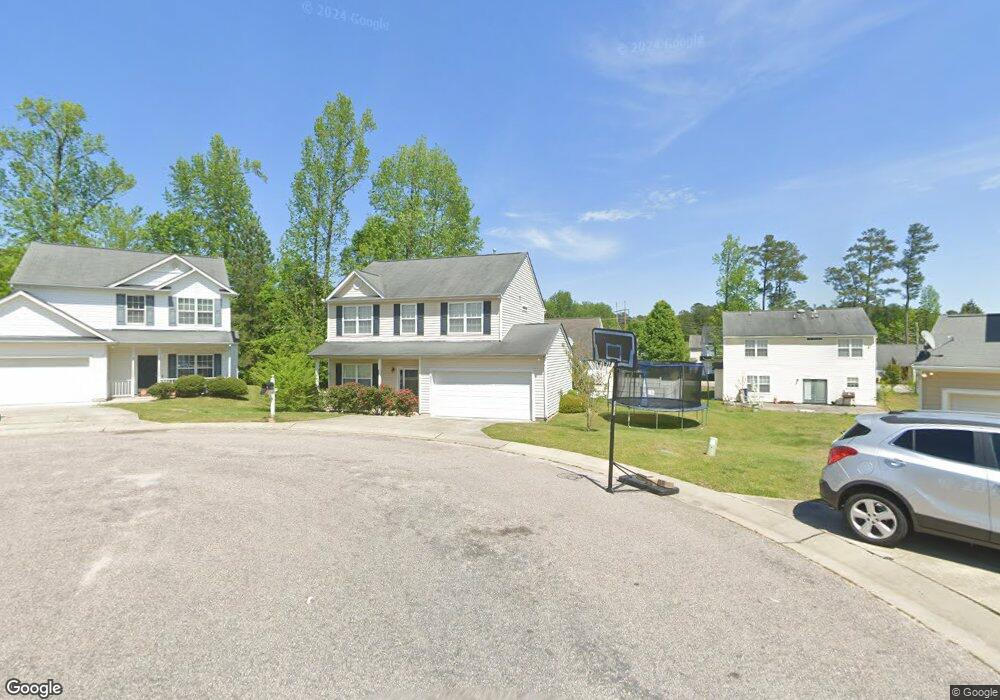
4905 Four Sons Ct Raleigh, NC 27610
Southeast Raleigh NeighborhoodEstimated Value: $330,000 - $346,000
3
Beds
3
Baths
1,715
Sq Ft
$198/Sq Ft
Est. Value
About This Home
This home is located at 4905 Four Sons Ct, Raleigh, NC 27610 and is currently estimated at $339,543, approximately $197 per square foot. 4905 Four Sons Ct is a home located in Wake County with nearby schools including Barwell Road Elementary School, Carnage Magnet Middle School, and South Garner High.
Ownership History
Date
Name
Owned For
Owner Type
Purchase Details
Closed on
Oct 28, 2020
Sold by
Spears Syretta and Cates Demetrius
Bought by
Spears Syretta
Current Estimated Value
Purchase Details
Closed on
Dec 21, 2006
Sold by
Daniels Donyea L
Bought by
Spears Syretta A
Home Financials for this Owner
Home Financials are based on the most recent Mortgage that was taken out on this home.
Original Mortgage
$147,831
Interest Rate
6.31%
Mortgage Type
FHA
Purchase Details
Closed on
Apr 8, 2004
Sold by
Jordans Construction Inc
Bought by
Daniels Donyea L
Home Financials for this Owner
Home Financials are based on the most recent Mortgage that was taken out on this home.
Original Mortgage
$119,250
Interest Rate
8.25%
Mortgage Type
Purchase Money Mortgage
Create a Home Valuation Report for This Property
The Home Valuation Report is an in-depth analysis detailing your home's value as well as a comparison with similar homes in the area
Home Values in the Area
Average Home Value in this Area
Purchase History
| Date | Buyer | Sale Price | Title Company |
|---|---|---|---|
| Spears Syretta | -- | None Available | |
| Spears Syretta | -- | None Listed On Document | |
| Spears Syretta A | $149,000 | None Available | |
| Daniels Donyea L | $133,000 | -- |
Source: Public Records
Mortgage History
| Date | Status | Borrower | Loan Amount |
|---|---|---|---|
| Previous Owner | Spears Syretta A | $147,831 | |
| Previous Owner | Daniels Donyea L | $119,250 | |
| Closed | Daniels Donyea L | $6,625 |
Source: Public Records
Tax History Compared to Growth
Tax History
| Year | Tax Paid | Tax Assessment Tax Assessment Total Assessment is a certain percentage of the fair market value that is determined by local assessors to be the total taxable value of land and additions on the property. | Land | Improvement |
|---|---|---|---|---|
| 2025 | $2,920 | $332,498 | $70,000 | $262,498 |
| 2024 | $2,908 | $332,498 | $70,000 | $262,498 |
| 2023 | $2,166 | $196,916 | $35,000 | $161,916 |
| 2022 | $2,014 | $196,916 | $35,000 | $161,916 |
| 2021 | $1,936 | $196,916 | $35,000 | $161,916 |
| 2020 | $1,901 | $196,916 | $35,000 | $161,916 |
| 2019 | $1,670 | $142,347 | $30,000 | $112,347 |
| 2018 | $1,575 | $142,347 | $30,000 | $112,347 |
| 2017 | $1,501 | $142,347 | $30,000 | $112,347 |
| 2016 | $1,470 | $142,347 | $30,000 | $112,347 |
| 2015 | $1,595 | $152,087 | $33,000 | $119,087 |
| 2014 | -- | $152,087 | $33,000 | $119,087 |
Source: Public Records
Map
Nearby Homes
- 1810 Eagle Beach Ct
- 1820 Eagle Beach Ct
- 4910 Blue Rock Ct
- 1220 Canyon Rock Ct Unit 107
- 1235 Stone Manor Dr
- 5625 Fieldcross Ct
- 5531 Fieldcross Ct
- 1211 Canyon Rock Ct Unit 103
- 1211 Canyon Rock Ct Unit 111
- 1220 Garden Stone Dr
- 5205 Pine Swell Way
- 2225 Walnut Ridge Ct
- 4365 Bethel Park Dr
- 4408 Poplar Dr
- 5011 Eagle Stone Ln Unit 106
- 5520 Oregon Landing Place
- 1606 Oxleymare Dr
- 1610 Oxleymare Dr
- 5602 Bringle Ct
- 1550 Brown Owl Dr
- 1636 Eva Mae Dr
- 4909 Four Sons Ct
- 4901 Four Sons Ct
- 1640 Eva Mae Dr
- 1628 Eva Mae Dr
- 4900 Four Sons Ct
- 1648 Eva Mae Dr
- 4913 Four Sons Ct
- 1624 Eva Mae Dr
- 4904 Four Sons Ct
- 4908 Four Sons Ct
- 1652 Eva Mae Dr
- 4918 Little Bud Ln
- 1620 Eva Mae Dr
- 4914 Little Bud Ln
- 1637 Eva Mae Dr
- 1641 Eva Mae Dr
- 1700 Eva Mae Dr
- 4912 Four Sons Ct
- 4915 Little Bud Ln