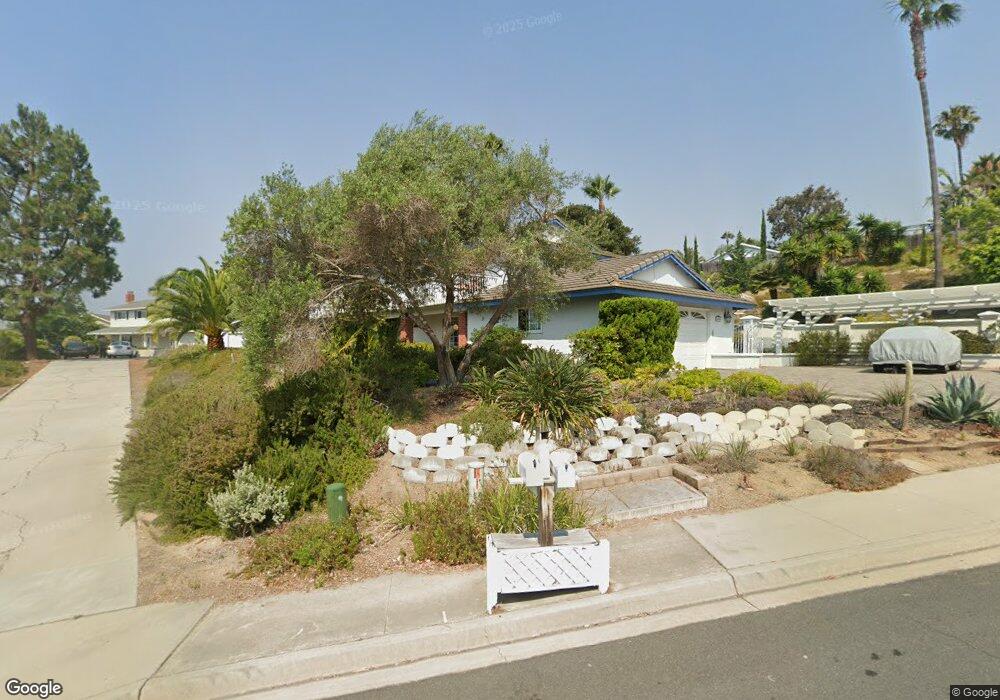
4905 Via Hinton Carlsbad, CA 92008
Hedionda Point NeighborhoodEstimated Value: $1,595,000 - $1,899,000
4
Beds
3
Baths
2,567
Sq Ft
$698/Sq Ft
Est. Value
About This Home
This home is located at 4905 Via Hinton, Carlsbad, CA 92008 and is currently estimated at $1,790,809, approximately $697 per square foot. 4905 Via Hinton is a home located in San Diego County with nearby schools including Kelly Elementary School, Carlsbad High School, and Sage Creek High.
Ownership History
Date
Name
Owned For
Owner Type
Purchase Details
Closed on
Jun 18, 2008
Sold by
Day Kevin R
Bought by
Day Kevin R
Current Estimated Value
Home Financials for this Owner
Home Financials are based on the most recent Mortgage that was taken out on this home.
Original Mortgage
$544,000
Outstanding Balance
$339,140
Interest Rate
5.5%
Mortgage Type
New Conventional
Estimated Equity
$1,451,669
Purchase Details
Closed on
Oct 2, 2006
Sold by
Day Kevin R and Day Kevin
Bought by
Day Kevin R
Home Financials for this Owner
Home Financials are based on the most recent Mortgage that was taken out on this home.
Original Mortgage
$539,900
Interest Rate
6.62%
Mortgage Type
Negative Amortization
Purchase Details
Closed on
Mar 11, 1983
Create a Home Valuation Report for This Property
The Home Valuation Report is an in-depth analysis detailing your home's value as well as a comparison with similar homes in the area
Home Values in the Area
Average Home Value in this Area
Purchase History
| Date | Buyer | Sale Price | Title Company |
|---|---|---|---|
| Day Kevin R | -- | Old Republic Title Company | |
| Day Kevin R | -- | First American Title Co | |
| Day Kevin R | -- | First American Title Co | |
| -- | $135,000 | -- |
Source: Public Records
Mortgage History
| Date | Status | Borrower | Loan Amount |
|---|---|---|---|
| Open | Day Kevin R | $544,000 | |
| Closed | Day Kevin R | $539,900 |
Source: Public Records
Tax History Compared to Growth
Tax History
| Year | Tax Paid | Tax Assessment Tax Assessment Total Assessment is a certain percentage of the fair market value that is determined by local assessors to be the total taxable value of land and additions on the property. | Land | Improvement |
|---|---|---|---|---|
| 2025 | $6,620 | $349,553 | $89,475 | $260,078 |
| 2024 | $6,620 | $342,700 | $87,721 | $254,979 |
| 2023 | $6,599 | $335,981 | $86,001 | $249,980 |
| 2022 | $6,542 | $329,394 | $84,315 | $245,079 |
| 2021 | $6,515 | $322,936 | $82,662 | $240,274 |
| 2020 | $6,445 | $319,626 | $81,815 | $237,811 |
| 2019 | $6,381 | $313,360 | $80,211 | $233,149 |
| 2018 | $6,231 | $307,217 | $78,639 | $228,578 |
| 2017 | $6,155 | $301,195 | $77,098 | $224,097 |
| 2016 | $3,145 | $295,290 | $75,587 | $219,703 |
| 2015 | $3,132 | $290,855 | $74,452 | $216,403 |
| 2014 | $3,080 | $285,158 | $72,994 | $212,164 |
Source: Public Records
Map
Nearby Homes
- 4806 Parsley Ln
- Plan 1732 Modeled at Coral Ridge
- Plan 1739 Modeled at Coral Ridge
- Plan 1688 Modeled at Coral Ridge
- 2572 Chamomile Ln
- Plan 2212 Modeled at Coral Springs
- 4654 Catmint Ln
- 4600 Catmint Ln
- 2579 Elderberry Ln
- Plan 1994 Modeled at Coral Springs
- 4636 Catmint Ln
- 2555 Elderberry Ln
- Plan 2070 Modeled at Coral Springs
- 2536 Elderberry Ln
- 2572 Elderberry Ln
- 2524 Chamomile Ln
- 4700 Parsley Ln
- 2559 Delphinium Ln
- 2336 Summerwind Place
- 4967 Cindy Ave