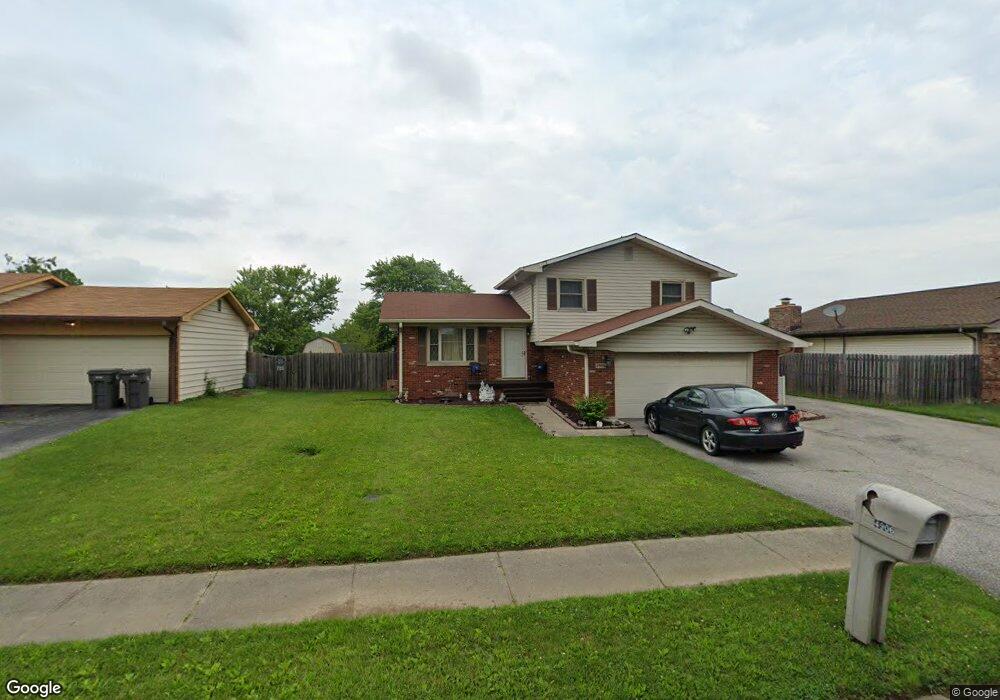
4906 Candy Spots Dr Indianapolis, IN 46237
South Emerson NeighborhoodEstimated Value: $234,000 - $242,000
3
Beds
2
Baths
1,556
Sq Ft
$153/Sq Ft
Est. Value
About This Home
This home is located at 4906 Candy Spots Dr, Indianapolis, IN 46237 and is currently estimated at $237,318, approximately $152 per square foot. 4906 Candy Spots Dr is a home located in Marion County with nearby schools including Franklin Central High School, Gray Road Christian School, and Indianapolis Southside Christian Academy.
Ownership History
Date
Name
Owned For
Owner Type
Purchase Details
Closed on
Oct 3, 2008
Sold by
Mccrary Paul A and Mccrary Barbara A
Bought by
Terry Troy A and Terry Milissa
Current Estimated Value
Home Financials for this Owner
Home Financials are based on the most recent Mortgage that was taken out on this home.
Original Mortgage
$106,539
Interest Rate
6.3%
Mortgage Type
FHA
Create a Home Valuation Report for This Property
The Home Valuation Report is an in-depth analysis detailing your home's value as well as a comparison with similar homes in the area
Home Values in the Area
Average Home Value in this Area
Purchase History
| Date | Buyer | Sale Price | Title Company |
|---|---|---|---|
| Terry Troy A | -- | Reo Title Services |
Source: Public Records
Mortgage History
| Date | Status | Borrower | Loan Amount |
|---|---|---|---|
| Previous Owner | Terry Troy A | $106,539 |
Source: Public Records
Tax History
| Year | Tax Paid | Tax Assessment Tax Assessment Total Assessment is a certain percentage of the fair market value that is determined by local assessors to be the total taxable value of land and additions on the property. | Land | Improvement |
|---|---|---|---|---|
| 2025 | $1,944 | $195,000 | $25,800 | $169,200 |
| 2024 | $2,004 | $194,400 | $25,800 | $168,600 |
| 2023 | $2,004 | $187,100 | $25,800 | $161,300 |
| 2022 | $1,935 | $179,200 | $25,800 | $153,400 |
| 2021 | $1,617 | $147,500 | $25,800 | $121,700 |
| 2020 | $1,478 | $133,900 | $25,800 | $108,100 |
| 2019 | $1,395 | $126,800 | $19,200 | $107,600 |
| 2018 | $1,267 | $114,300 | $19,200 | $95,100 |
| 2017 | $1,176 | $105,700 | $19,200 | $86,500 |
| 2016 | $1,135 | $101,900 | $19,200 | $82,700 |
| 2014 | $955 | $94,300 | $19,200 | $75,100 |
| 2013 | $955 | $94,300 | $19,200 | $75,100 |
Source: Public Records
Map
Nearby Homes
- 4945 Royal Orbit Ct
- 4921 Candy Spots Dr
- 4930 Candy Spots Dr
- 5551 Personality Ct
- 4829 Dancer Dr
- 5120 Pappas Dr
- 5118 Gringo Dr
- 5147 Antigua Trail
- 5135 Brouse Ct
- 5102 Triple Crown Way
- 5106 Triple Crown Way
- 5110 Triple Crown Way
- 5858 Timber Lake Blvd
- 5103 Triple Crown Way
- 5111 Triple Crown Way
- 5115 Triple Crown Way
- 5146 Triple Crown Way
- 6044 Medina Spirit Dr
- 5107 Triple Crown Way
- 5474 Sleet Dr
- 4910 Candy Spots Dr
- 4902 Candy Spots Dr
- 4914 Candy Spots Dr
- 5519 Whirlaway Cir
- 5513 Whirlaway Cir
- 4828 Whirlaway Dr
- 5507 Whirlaway Cir
- 4918 Candy Spots Dr
- 4901 Candy Spots Dr
- 4832 Candy Spots Dr
- 5601 Whirlaway Ct
- 4835 Candy Spots Dr
- 4920 Candy Spots Dr
- 4828 Candy Spots Dr
- 5501 Whirlaway Cir
- 4926 Royal Orbit Ct
- 4925 Candy Spots Dr
- 5607 Whirlaway Ct
- 5520 Whirlaway Cir
- 4830 Candy Spots Ct
Your Personal Tour Guide
Ask me questions while you tour the home.