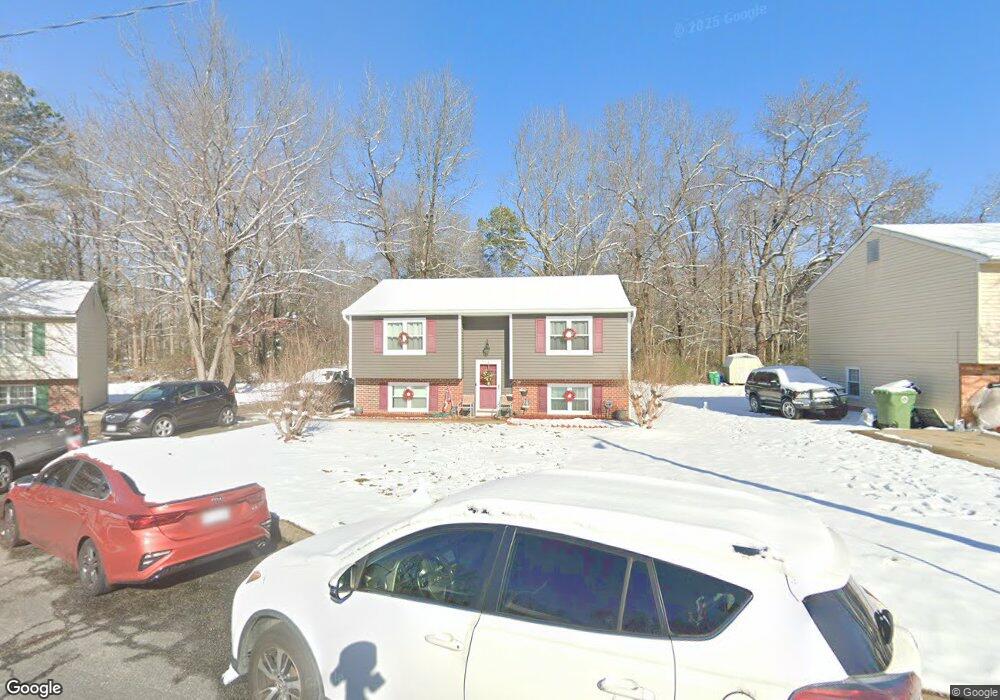
4906 Lindy Ln Richmond, VA 23224
South Garden NeighborhoodEstimated Value: $234,000 - $300,000
4
Beds
2
Baths
1,788
Sq Ft
$156/Sq Ft
Est. Value
About This Home
This home is located at 4906 Lindy Ln, Richmond, VA 23224 and is currently estimated at $278,326, approximately $155 per square foot. 4906 Lindy Ln is a home located in Richmond City with nearby schools including J.L. Francis Elementary School, Open High School, and Huguenot High School.
Ownership History
Date
Name
Owned For
Owner Type
Purchase Details
Closed on
Jun 14, 2017
Sold by
Tran That Kim and Sok Sophom
Bought by
Mayfield Patricia C and Mayfield Marvin E
Current Estimated Value
Home Financials for this Owner
Home Financials are based on the most recent Mortgage that was taken out on this home.
Original Mortgage
$117,826
Outstanding Balance
$97,656
Interest Rate
3.89%
Mortgage Type
FHA
Estimated Equity
$180,670
Create a Home Valuation Report for This Property
The Home Valuation Report is an in-depth analysis detailing your home's value as well as a comparison with similar homes in the area
Home Values in the Area
Average Home Value in this Area
Purchase History
| Date | Buyer | Sale Price | Title Company |
|---|---|---|---|
| Mayfield Patricia C | $120,000 | Csc Title & Settlement Llc |
Source: Public Records
Mortgage History
| Date | Status | Borrower | Loan Amount |
|---|---|---|---|
| Open | Mayfield Patricia C | $117,826 |
Source: Public Records
Tax History Compared to Growth
Tax History
| Year | Tax Paid | Tax Assessment Tax Assessment Total Assessment is a certain percentage of the fair market value that is determined by local assessors to be the total taxable value of land and additions on the property. | Land | Improvement |
|---|---|---|---|---|
| 2025 | $2,892 | $241,000 | $42,000 | $199,000 |
| 2024 | $2,784 | $232,000 | $39,000 | $193,000 |
| 2023 | $2,400 | $200,000 | $30,000 | $170,000 |
| 2022 | $2,064 | $172,000 | $30,000 | $142,000 |
| 2021 | $1,476 | $129,000 | $20,000 | $109,000 |
| 2020 | $1,476 | $123,000 | $20,000 | $103,000 |
| 2019 | $1,464 | $122,000 | $20,000 | $102,000 |
| 2018 | $1,380 | $115,000 | $20,000 | $95,000 |
| 2017 | $1,308 | $109,000 | $20,000 | $89,000 |
| 2016 | $1,368 | $114,000 | $20,000 | $94,000 |
| 2015 | $1,404 | $117,000 | $20,000 | $97,000 |
| 2014 | $1,404 | $117,000 | $20,000 | $97,000 |
Source: Public Records
Map
Nearby Homes
- 5018 Orcutt Ln
- 5018 Burtwood Ln
- 4616 Ferguson Ln
- 2710 Pauls Ln
- 2431 Brinkwood Dr
- 1923 Powell Rd
- 5221 Snead Rd
- 5425 Burtwood Ln
- 2228 Cullen Rd
- 5331 White Oak Dr
- 4701 Cooks Rd
- 1827 Clarkson Rd
- 4060 Norborne Rd
- 2401 Clearfield St
- 4913 Belmont Rd
- 3531 Dorset Rd
- 2549 Clearfield St
- 3106 Hopkins Rd
- 3401 Marwick Place
- 3006 Baronet Dr