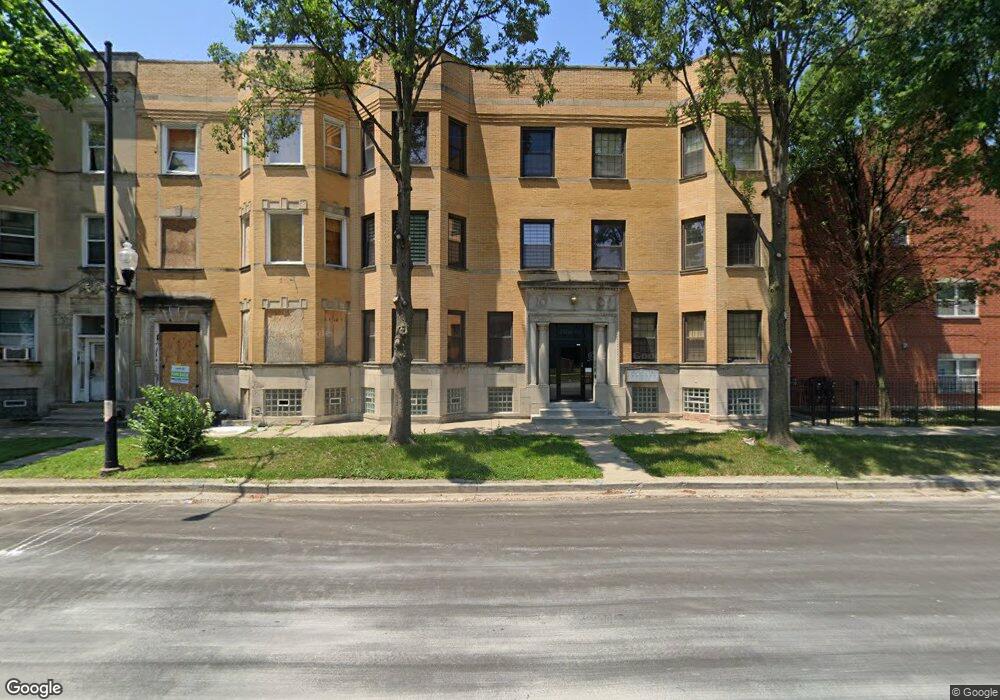
4906 S Indiana Ave Unit 49061 Chicago, IL 60615
Grand Boulevard NeighborhoodEstimated Value: $297,000 - $344,088
4
Beds
3
Baths
2,700
Sq Ft
$118/Sq Ft
Est. Value
About This Home
This home is located at 4906 S Indiana Ave Unit 49061, Chicago, IL 60615 and is currently estimated at $318,272, approximately $117 per square foot. 4906 S Indiana Ave Unit 49061 is a home located in Cook County with nearby schools including Burke Elementary School, Wendell Phillips Academy High School, and Ace Amandla Charter High School.
Ownership History
Date
Name
Owned For
Owner Type
Purchase Details
Closed on
Feb 24, 2021
Sold by
Ignatius Joseph and Ignatius Sharon
Bought by
Land Ignatius Sharon and Ignatius Joseph
Current Estimated Value
Purchase Details
Closed on
Dec 27, 2004
Sold by
Sokolowski Marek and Olejniczak Edward
Bought by
Ignatius Joseph and Ignatius Sharon
Home Financials for this Owner
Home Financials are based on the most recent Mortgage that was taken out on this home.
Original Mortgage
$241,100
Outstanding Balance
$123,734
Interest Rate
6%
Mortgage Type
Purchase Money Mortgage
Estimated Equity
$194,538
Purchase Details
Closed on
Jan 5, 2004
Sold by
Mitchell Willie L and Mitchell Annie A
Bought by
Sokolowski Marek and Olejnicsak Edward
Home Financials for this Owner
Home Financials are based on the most recent Mortgage that was taken out on this home.
Original Mortgage
$244,000
Interest Rate
5.77%
Mortgage Type
Purchase Money Mortgage
Create a Home Valuation Report for This Property
The Home Valuation Report is an in-depth analysis detailing your home's value as well as a comparison with similar homes in the area
Home Values in the Area
Average Home Value in this Area
Purchase History
| Date | Buyer | Sale Price | Title Company |
|---|---|---|---|
| Land Ignatius Sharon | -- | Attorney | |
| Ignatius Joseph | $268,000 | Professional National Title | |
| Sokolowski Marek | $305,000 | Stewart Title Of Illinois |
Source: Public Records
Mortgage History
| Date | Status | Borrower | Loan Amount |
|---|---|---|---|
| Open | Ignatius Joseph | $241,100 | |
| Previous Owner | Sokolowski Marek | $244,000 |
Source: Public Records
Tax History Compared to Growth
Tax History
| Year | Tax Paid | Tax Assessment Tax Assessment Total Assessment is a certain percentage of the fair market value that is determined by local assessors to be the total taxable value of land and additions on the property. | Land | Improvement |
|---|---|---|---|---|
| 2024 | $4,167 | $24,714 | $5,354 | $19,360 |
| 2023 | $4,040 | $23,000 | $5,354 | $17,646 |
| 2022 | $4,040 | $23,000 | $5,354 | $17,646 |
| 2021 | $3,967 | $22,999 | $5,353 | $17,646 |
| 2020 | $2,481 | $14,239 | $2,600 | $11,639 |
| 2019 | $2,466 | $15,701 | $2,600 | $13,101 |
| 2018 | $2,423 | $15,701 | $2,600 | $13,101 |
| 2017 | $2,179 | $13,498 | $2,141 | $11,357 |
| 2016 | $2,203 | $13,498 | $2,141 | $11,357 |
| 2015 | $1,993 | $13,498 | $2,141 | $11,357 |
| 2014 | $3,629 | $22,129 | $1,835 | $20,294 |
| 2013 | $3,546 | $22,129 | $1,835 | $20,294 |
Source: Public Records
Map
Nearby Homes
- 4908 S Indiana Ave
- 4840 S Indiana Ave
- 4832 S Indiana Ave Unit G-28
- 4856 S Prairie Ave Unit G
- 4856 S Prairie Ave Unit 2
- 4931 S Prairie Ave Unit 2
- 4937 S Prairie Ave
- 4933 S Wabash Ave
- 5004 S Prairie Ave
- 4809 S Wabash Ave Unit 1
- 5039 S Michigan Ave Unit 1
- 5032 S Michigan Ave
- 4744 S Prairie Ave Unit 1A
- 4735 S Indiana Ave
- 350 E 50th St
- 4932 S Doctor Martin Luther King Junior Dr
- 121 E 47th St
- 4758 S King Dr Unit 4
- 5127 S Indiana Ave
- 4915 S Doctor Martin Luther King Junior Dr
- 4908 S Indiana Ave Unit 1
- 4906 S Indiana Ave Unit 2S
- 4906 S Indiana Ave Unit 49062
- 4906 S Indiana Ave Unit 49063
- 4906 S Indiana Ave Unit 3S
- 4906 S Indiana Ave Unit 2
- 4906 S Indiana Ave Unit 3
- 4906 S Indiana Ave Unit 1S
- 4904 S Indiana Ave Unit 49042
- 4904 S Indiana Ave Unit 49043
- 4904 S Indiana Ave Unit 49041
- 4904 S Indiana Ave Unit 2N
- 4904 S Indiana Ave Unit 1N
- 4904 S Indiana Ave Unit 2
- 4910 S Indiana Ave
- 4910 S Indiana Ave
- 4918 S Indiana Ave Unit 4S
- 4918 S Indiana Ave Unit 3N
- 4918 S Indiana Ave Unit 1S
- 4918 S Indiana Ave Unit 4N