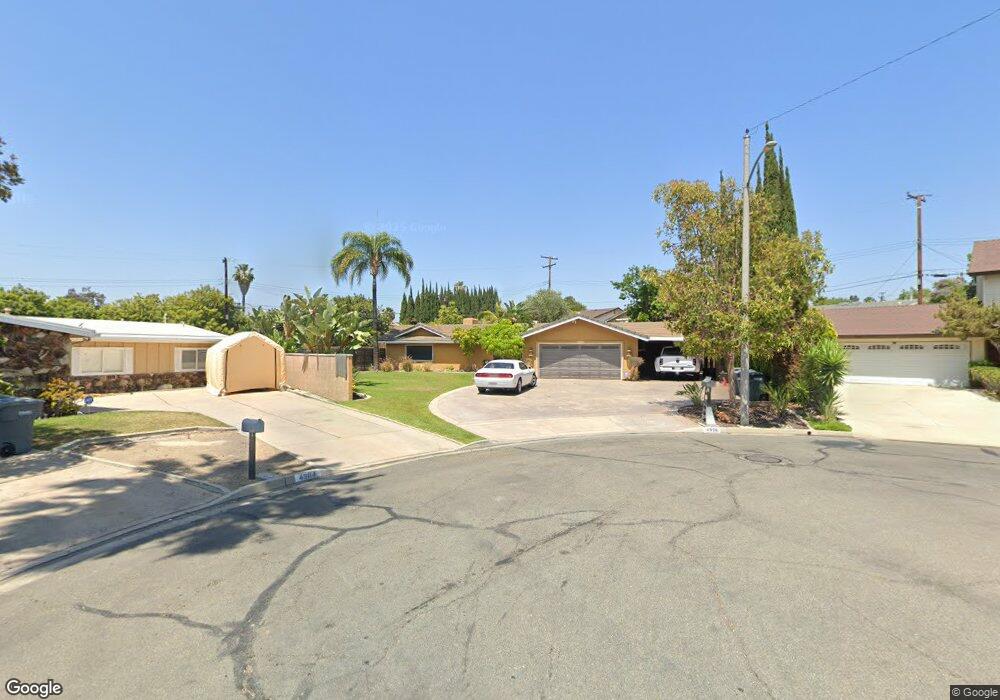
4906 Saint Andrews Cir Buena Park, CA 90621
Estimated Value: $1,170,000 - $1,605,000
3
Beds
2
Baths
2,344
Sq Ft
$582/Sq Ft
Est. Value
About This Home
This home is located at 4906 Saint Andrews Cir, Buena Park, CA 90621 and is currently estimated at $1,363,594, approximately $581 per square foot. 4906 Saint Andrews Cir is a home located in Orange County with nearby schools including Gordon H. Beatty Elementary School, Buena Park Junior High School, and Sunny Hills High School.
Ownership History
Date
Name
Owned For
Owner Type
Purchase Details
Closed on
Dec 12, 2000
Sold by
Chang Wei Chia
Bought by
Vovos Dimitrios
Current Estimated Value
Home Financials for this Owner
Home Financials are based on the most recent Mortgage that was taken out on this home.
Original Mortgage
$311,200
Interest Rate
8.62%
Purchase Details
Closed on
Jun 23, 1995
Sold by
Chen Stella
Bought by
Chang Wei Chia
Home Financials for this Owner
Home Financials are based on the most recent Mortgage that was taken out on this home.
Original Mortgage
$139,500
Interest Rate
7.92%
Purchase Details
Closed on
May 23, 1995
Sold by
Fuller Glenn C and Fuller Nancy
Bought by
Chang Wei Chia
Home Financials for this Owner
Home Financials are based on the most recent Mortgage that was taken out on this home.
Original Mortgage
$139,500
Interest Rate
7.92%
Create a Home Valuation Report for This Property
The Home Valuation Report is an in-depth analysis detailing your home's value as well as a comparison with similar homes in the area
Home Values in the Area
Average Home Value in this Area
Purchase History
| Date | Buyer | Sale Price | Title Company |
|---|---|---|---|
| Vovos Dimitrios | $389,000 | United Title Company | |
| Chang Wei Chia | -- | Continental Lawyers Title Co | |
| Chang Wei Chia | $279,000 | Continental Lawyers Title Co |
Source: Public Records
Mortgage History
| Date | Status | Borrower | Loan Amount |
|---|---|---|---|
| Previous Owner | Vovos Dimitrios | $311,200 | |
| Previous Owner | Chang Wei Chia | $139,500 |
Source: Public Records
Tax History Compared to Growth
Tax History
| Year | Tax Paid | Tax Assessment Tax Assessment Total Assessment is a certain percentage of the fair market value that is determined by local assessors to be the total taxable value of land and additions on the property. | Land | Improvement |
|---|---|---|---|---|
| 2025 | $6,603 | $586,158 | $447,159 | $138,999 |
| 2024 | $6,603 | $574,665 | $438,391 | $136,274 |
| 2023 | $6,470 | $563,398 | $429,796 | $133,602 |
| 2022 | $6,367 | $552,351 | $421,368 | $130,983 |
| 2021 | $6,321 | $541,521 | $413,106 | $128,415 |
| 2020 | $6,244 | $535,969 | $408,870 | $127,099 |
| 2019 | $6,093 | $525,460 | $400,853 | $124,607 |
| 2018 | $5,976 | $515,157 | $392,993 | $122,164 |
| 2017 | $5,891 | $505,056 | $385,287 | $119,769 |
| 2016 | $5,774 | $495,153 | $377,732 | $117,421 |
| 2015 | $5,522 | $487,716 | $372,058 | $115,658 |
| 2014 | $5,506 | $478,163 | $364,770 | $113,393 |
Source: Public Records
Map
Nearby Homes
- 4900 Lincolnshire Ave
- 4738 Durango Dr
- 8244 Henderson Green
- 5211 Fox Hills Ave
- 14806 Faceta Dr
- 2150 Cheyenne Way Unit 169
- 14724 Mercado Ave
- 5412 Arrowhead Ave
- 2200 Cheyenne Way Unit 117
- 14828 Rayfield Dr
- 8237 Henshaw Cir
- 8542 Emerywood Dr
- 5471 Jonesboro Way
- 15213 Santa Gertrudes Ave Unit W106
- 15233 Santa Gertrudes Ave
- 5588 Cajon Ave
- 9 Coveside Ct
- 15220 Ocaso Ave Unit H103
- 15224 Ocaso Ave Unit H212
- 15011 La Mesa Dr
- 4908 Saint Andrews Cir
- 4904 Saint Andrews Cir
- 8362 Ridglea Ave
- 4831 Sunnybrook Ave
- 4851 Sunnybrook Ave
- 8342 Ridglea Ave
- 4821 Sunnybrook Ave
- 8382 Ridglea Ave
- 4871 Sunnybrook Ave
- 4910 Saint Andrews Cir
- 4902 Saint Andrews Cir
- 4811 Sunnybrook Ave
- 4885 Sunnybrook Ave
- 8332 Ridglea Ave
- 4900 Saint Andrews Ave
- 4920 Saint Andrews Ave
- 4890 Saint Andrews Ave
- 4801 Sunnybrook Ave
- 4924 Saint Andrews Ave
- 4895 Sunnybrook Ave