Estimated Value: $261,299 - $328,000
3
Beds
3
Baths
1,792
Sq Ft
$157/Sq Ft
Est. Value
About This Home
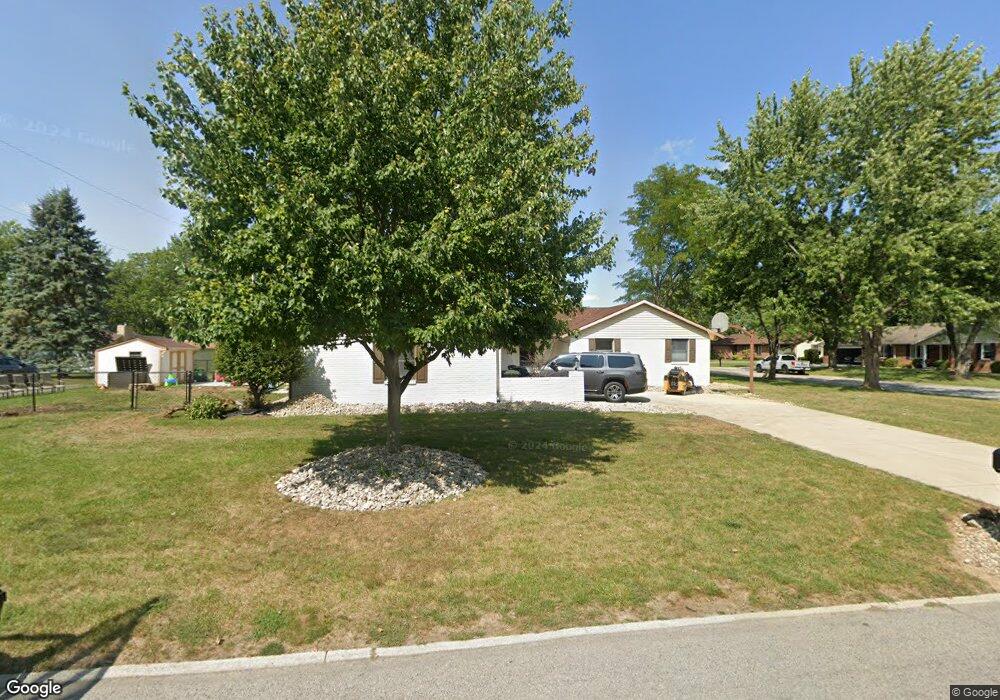
This home is located at 4906 Sycamore St, Lima, OH 45807 and is currently estimated at $280,825, approximately $156 per square foot. 4906 Sycamore St is a home located in Allen County with nearby schools including Elida Elementary School, Elida Middle School, and Elida High School.
Ownership History
Date
Name
Owned For
Owner Type
Purchase Details
Closed on
May 25, 2023
Sold by
Williams Debra
Bought by
Schuh Anthony J and Schuh Taylor A
Current Estimated Value
Home Financials for this Owner
Home Financials are based on the most recent Mortgage that was taken out on this home.
Original Mortgage
$182,450
Interest Rate
6.39%
Mortgage Type
New Conventional
Purchase Details
Closed on
Oct 26, 2022
Bought by
Debra Williams
Purchase Details
Closed on
Aug 8, 1985
Bought by
Williams Michael
Create a Home Valuation Report for This Property
The Home Valuation Report is an in-depth analysis detailing your home's value as well as a comparison with similar homes in the area
Purchase History
| Date | Buyer | Sale Price | Title Company |
|---|---|---|---|
| Schuh Anthony J | $205,000 | None Listed On Document | |
| Debra Williams | -- | -- | |
| Williams Michael | $11,900 | -- |
Source: Public Records
Mortgage History
| Date | Status | Borrower | Loan Amount |
|---|---|---|---|
| Previous Owner | Schuh Anthony J | $182,450 |
Source: Public Records
Tax History
| Year | Tax Paid | Tax Assessment Tax Assessment Total Assessment is a certain percentage of the fair market value that is determined by local assessors to be the total taxable value of land and additions on the property. | Land | Improvement |
|---|---|---|---|---|
| 2024 | $3,416 | $78,790 | $9,770 | $69,020 |
| 2023 | $2,644 | $63,530 | $7,880 | $55,650 |
| 2022 | $2,718 | $63,530 | $7,880 | $55,650 |
| 2021 | $2,732 | $63,530 | $7,880 | $55,650 |
| 2020 | $2,462 | $54,600 | $7,280 | $47,320 |
| 2019 | $2,462 | $54,600 | $7,280 | $47,320 |
| 2018 | $2,480 | $54,600 | $7,280 | $47,320 |
| 2017 | $2,073 | $48,440 | $7,280 | $41,160 |
| 2016 | $2,073 | $48,440 | $7,280 | $41,160 |
| 2015 | $1,943 | $48,440 | $7,280 | $41,160 |
| 2014 | $1,943 | $44,420 | $7,070 | $37,350 |
| 2013 | $1,745 | $44,420 | $7,070 | $37,350 |
Source: Public Records
Map
Nearby Homes
- 5031 Daisy Ln
- 4864 Pheasant St
- 2877 Whippoorwill Ave
- 4910 Amaryllis St
- 5643 Clover Ridge Dr
- 5126 Pheasant St
- 4901 Lobo St
- 2568 Susan Ann Dr
- 0 Alix Dr
- 5280 Lobo St
- 715 Wildwood Ave
- 2561 Baty Rd
- 114 Roger St
- 2105 Dutch Hollow Rd
- 4250 Diller Rd
- 0000 Diller Rd
- 1955 Dutch Hollow Rd
- 0000 Baty Rd
- 5924 Timberstone Dr
- 3055 Freyer Rd
- 2839 Hollyhock Ave
- 4922 Sycamore St
- 4905 Sycamore St
- 2814 Hummingbird St
- 2818 Hollyhock Ave
- 2849 Hollyhock Ave
- 4854 Sycamore St
- 2826 Hummingbird St
- 4875 Sycamore St
- 2844 Hollyhock Ave
- 2859 Hollyhock Ave
- 2811 Wren Ave
- 2772 Hummingbird St
- 4867 Sycamore St
- 2838 Hummingbird St
- 2819 Wren Ave
- 4950 Sycamore St
- 2858 Hollyhock Ave
Your Personal Tour Guide
Ask me questions while you tour the home.