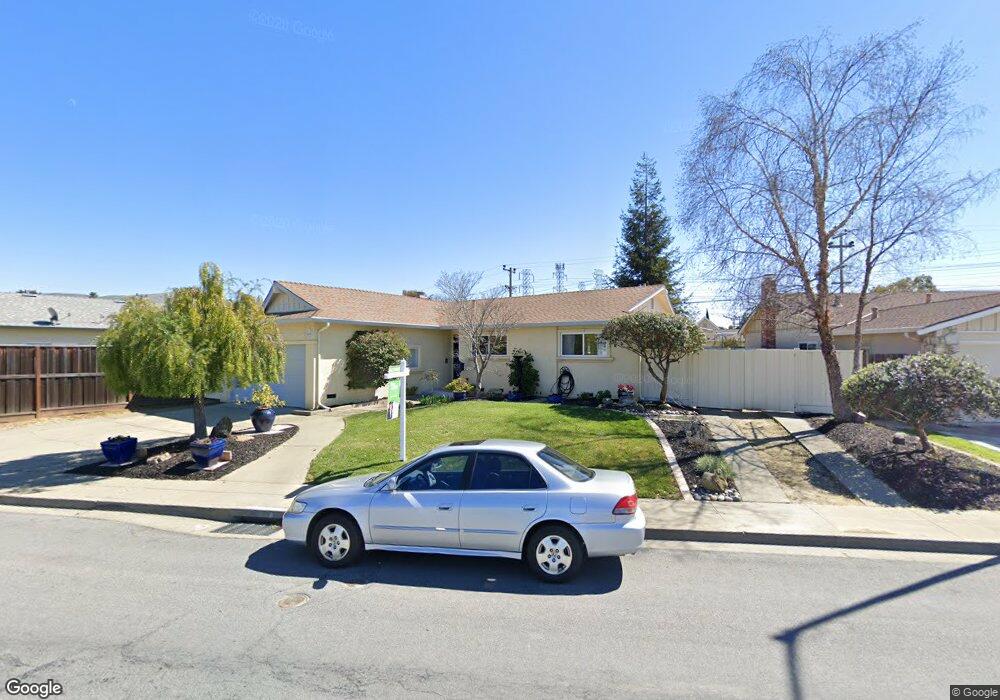
4906 Yellowstone Park Dr Fremont, CA 94538
Blacow NeighborhoodEstimated Value: $1,469,000 - $1,737,004
4
Beds
2
Baths
1,589
Sq Ft
$1,029/Sq Ft
Est. Value
About This Home
This home is located at 4906 Yellowstone Park Dr, Fremont, CA 94538 and is currently estimated at $1,635,501, approximately $1,029 per square foot. 4906 Yellowstone Park Dr is a home located in Alameda County with nearby schools including Steven Millard Elementary, G.M. Walters Middle School, and John F. Kennedy High School.
Ownership History
Date
Name
Owned For
Owner Type
Purchase Details
Closed on
Mar 19, 2019
Sold by
Waechtler Kenneth D and Waechtler Kathleen A
Bought by
Waghmare Amol Prakash and Lele Tejaswini
Current Estimated Value
Home Financials for this Owner
Home Financials are based on the most recent Mortgage that was taken out on this home.
Original Mortgage
$822,400
Outstanding Balance
$723,030
Interest Rate
4.4%
Mortgage Type
New Conventional
Estimated Equity
$912,471
Purchase Details
Closed on
Nov 27, 2018
Sold by
Waechtler Kenneth D and Waechtler Kathleen A
Bought by
Waechtler Kenneth D and Waechtler Kathleen A
Purchase Details
Closed on
Nov 16, 1993
Sold by
Duke Hale K and Duke Delores M
Bought by
Waechtler Kenneth D and Waechtler Kathleen A
Create a Home Valuation Report for This Property
The Home Valuation Report is an in-depth analysis detailing your home's value as well as a comparison with similar homes in the area
Home Values in the Area
Average Home Value in this Area
Purchase History
| Date | Buyer | Sale Price | Title Company |
|---|---|---|---|
| Waghmare Amol Prakash | $1,028,000 | Fidelity National Title Co | |
| Waechtler Kenneth D | -- | None Available | |
| Waechtler Kenneth D | -- | -- |
Source: Public Records
Mortgage History
| Date | Status | Borrower | Loan Amount |
|---|---|---|---|
| Open | Waghmare Amol Prakash | $822,400 |
Source: Public Records
Tax History Compared to Growth
Tax History
| Year | Tax Paid | Tax Assessment Tax Assessment Total Assessment is a certain percentage of the fair market value that is determined by local assessors to be the total taxable value of land and additions on the property. | Land | Improvement |
|---|---|---|---|---|
| 2025 | $13,562 | $1,146,734 | $501,975 | $644,759 |
| 2024 | $13,562 | $1,124,251 | $492,133 | $632,118 |
| 2023 | $13,207 | $1,102,210 | $482,485 | $619,725 |
| 2022 | $13,049 | $1,080,602 | $473,026 | $607,576 |
| 2021 | $12,727 | $1,059,415 | $463,752 | $595,663 |
| 2020 | $12,802 | $1,048,560 | $459,000 | $589,560 |
| 2019 | $3,331 | $238,021 | $102,559 | $135,462 |
| 2018 | $3,189 | $233,354 | $100,548 | $132,806 |
| 2017 | $3,107 | $228,780 | $98,577 | $130,203 |
| 2016 | $3,041 | $224,294 | $96,644 | $127,650 |
| 2015 | $3,008 | $220,926 | $95,193 | $125,733 |
| 2014 | $2,946 | $216,598 | $93,328 | $123,270 |
Source: Public Records
Map
Nearby Homes
- 43163 Grimmer Terrace
- 48 Eagle Green
- 92 Delta Green
- 42932 Peachwood St
- 202 Manitoba Terrace
- 4860 Bryce Canyon Park Dr
- 208 Manitoba Terrace
- 262 Manitoba Green
- 5560 Boscell Common
- 261 Manitoba Green Unit 261
- 257 Manitoba Green
- 4537 Capewood Terrace
- 4533 Capewood Terrace
- 4309 Bora Ave
- 5341 Audubon Park Ct
- 41882 Gifford St
- 4751 Wadsworth Ct
- 42759 Newport Dr
- 40696 Robin St
- 3923 Wildflower Common Unit 19
- 4912 Yellowstone Park Dr
- 43324 Isle Royal St
- 43312 Isle Royal St
- 43332 Isle Royal St
- 4909 Everglades Park Dr
- 4918 Yellowstone Park Dr
- 4909 Yellowstone Park Dr
- 4915 Everglades Park Dr
- 4911 Yellowstone Park Dr
- 43344 Isle Royal St
- 4905 Yellowstone Park Dr
- 4924 Yellowstone Park Dr
- 4921 Everglades Park Dr
- 4919 Yellowstone Park Dr
- 4901 Yellowstone Park Dr
- 43325 Isle Royal St
- 43313 Isle Royal St
- 4915 Hyde Park Dr
- 4927 Everglades Park Dr
- 4930 Yellowstone Park Dr