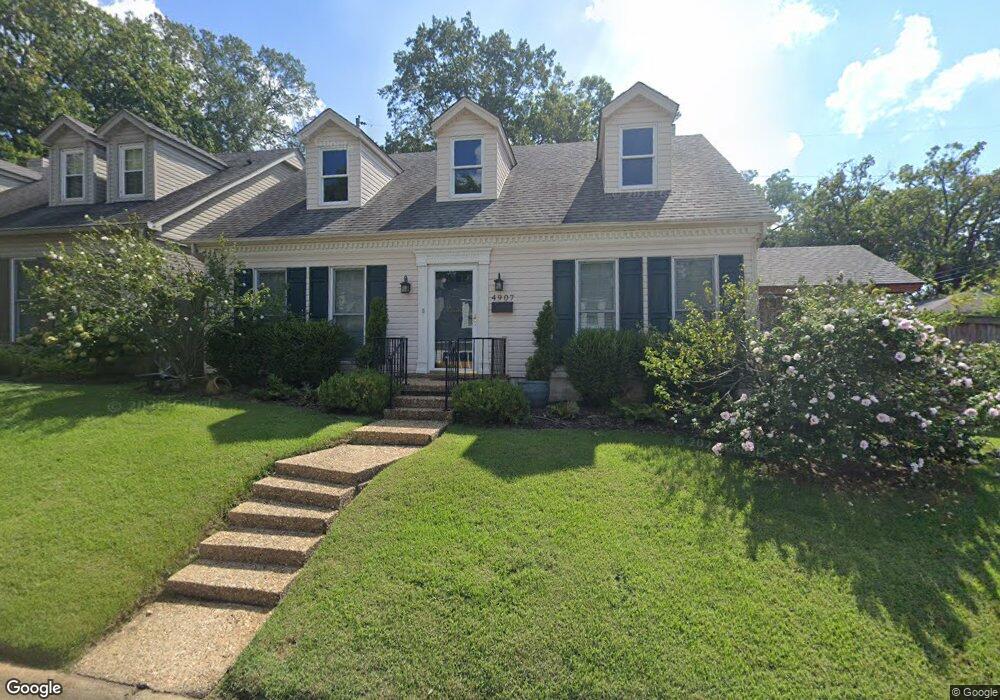
4907 B St Little Rock, AR 72205
Hillcrest NeighborhoodEstimated Value: $286,000 - $357,000
--
Bed
3
Baths
1,829
Sq Ft
$179/Sq Ft
Est. Value
About This Home
This home is located at 4907 B St, Little Rock, AR 72205 and is currently estimated at $326,684, approximately $178 per square foot. 4907 B St is a home located in Pulaski County with nearby schools including Pulaski Heights Elementary School, Pulaski Heights Middle School, and Central High School.
Ownership History
Date
Name
Owned For
Owner Type
Purchase Details
Closed on
Mar 29, 2016
Sold by
Burrow Gary L
Bought by
Edge Nicola A and Burrow Nicola A
Current Estimated Value
Purchase Details
Closed on
Nov 10, 2015
Sold by
Mogan Danna Sue Crouch and Morgan Patrick
Bought by
Burrow Nicola A
Home Financials for this Owner
Home Financials are based on the most recent Mortgage that was taken out on this home.
Original Mortgage
$229,900
Outstanding Balance
$180,889
Interest Rate
3.8%
Mortgage Type
New Conventional
Estimated Equity
$145,795
Purchase Details
Closed on
Jul 27, 2000
Sold by
Dickey Lila Henslee
Bought by
Crouch Danna Sue and Morgan Patrick
Home Financials for this Owner
Home Financials are based on the most recent Mortgage that was taken out on this home.
Original Mortgage
$87,000
Interest Rate
8.21%
Mortgage Type
Purchase Money Mortgage
Create a Home Valuation Report for This Property
The Home Valuation Report is an in-depth analysis detailing your home's value as well as a comparison with similar homes in the area
Home Values in the Area
Average Home Value in this Area
Purchase History
| Date | Buyer | Sale Price | Title Company |
|---|---|---|---|
| Edge Nicola A | -- | Attorney | |
| Burrow Nicola A | $242,000 | American Abstract & Title Co | |
| Crouch Danna Sue | $119,000 | Lenders Title Company |
Source: Public Records
Mortgage History
| Date | Status | Borrower | Loan Amount |
|---|---|---|---|
| Open | Burrow Nicola A | $229,900 | |
| Previous Owner | Crouch Danna Sue | $87,000 | |
| Closed | Crouch Danna Sue | $17,500 |
Source: Public Records
Tax History Compared to Growth
Tax History
| Year | Tax Paid | Tax Assessment Tax Assessment Total Assessment is a certain percentage of the fair market value that is determined by local assessors to be the total taxable value of land and additions on the property. | Land | Improvement |
|---|---|---|---|---|
| 2025 | $3,950 | $62,352 | $9,000 | $53,352 |
| 2024 | $3,621 | $62,352 | $9,000 | $53,352 |
| 2023 | $3,621 | $62,352 | $9,000 | $53,352 |
| 2022 | $3,457 | $62,352 | $9,000 | $53,352 |
| 2021 | $3,316 | $47,030 | $12,000 | $35,030 |
| 2020 | $2,917 | $47,030 | $12,000 | $35,030 |
| 2019 | $2,917 | $47,030 | $12,000 | $35,030 |
| 2018 | $2,942 | $47,030 | $12,000 | $35,030 |
| 2017 | $2,931 | $47,030 | $12,000 | $35,030 |
| 2016 | $2,775 | $44,640 | $5,780 | $38,860 |
| 2015 | $2,541 | $36,245 | $5,780 | $30,465 |
| 2014 | $2,541 | $33,225 | $5,780 | $27,445 |
Source: Public Records
Map
Nearby Homes